One of the most important unsolved problems in DeFi is LP profitability. Namely, how can passive AMM liquidity providers consistently make a profit in the face of arbitrageurs, market volatility, and a limited strategy space?
Decentralized exchanges such as Uniswap are perhaps the most important apps in DeFi. They enable trading one asset for another without any centralized middlemen, which is a massively important financial primitive that has ramifications not just in crypto but in the wider society as well. However, existing DEXes all suffer from one lethal problem: their liquidity providers are actively losing money from providing trading liquidity that’s the backbone of the crypto economy.
At Bunni, we have built the most powerful DEX to date. Bunni is a DEX built as a Uniswap v4 hook that makes extensive use of Uniswap v4’s flexibility. Bunni enables liquidity to shapeshift, which means automatically and efficiently adjusting what prices to provide liquidity at and how to distribute the liquidity. Bunni also has dynamic swap fees that increase when the market becomes volatile, rehypothecation which deposits idle liquidity into lending/yield protocols to earn extra yield, as well as a variety of other features. You can check it out at bunni.xyz.
We at Bunni are in a unique position to advance research in LP profitability. In the past, researchers have only been able to study existing DEXes, having no ability to modify parameters & LP strategies and run experiments on what can improve LP profits. They’ve been like “There! Now that I’ve conclusively proved LPs are losing a lot of money, surely I’ll be invited to lots of parties right?” Fastforward to today, Bunni has drastically expanded the space of possible LP strategies such that we can actually run lots of experiments and see what improves LP profits. We have found Bunni to be the perfect playground for DEX researchers, and we certainly hope that more researchers will hop aboard the Bunni train.
This post explores the results from our experiments so far. No, we haven’t solved LP profitability yet, but we have made enough interesting observations such that we’re optimistic that we will solve it within the next 2 months. This is why this post is titled “Dawn of LP profitability”: we can only see glimmers right now, but day is surely coming. Hope you enjoy it!
Prelude: Disaster Strikes
It all started when I noticed a Bunni pool with \$900 of liquidity doing \$18k daily volume.
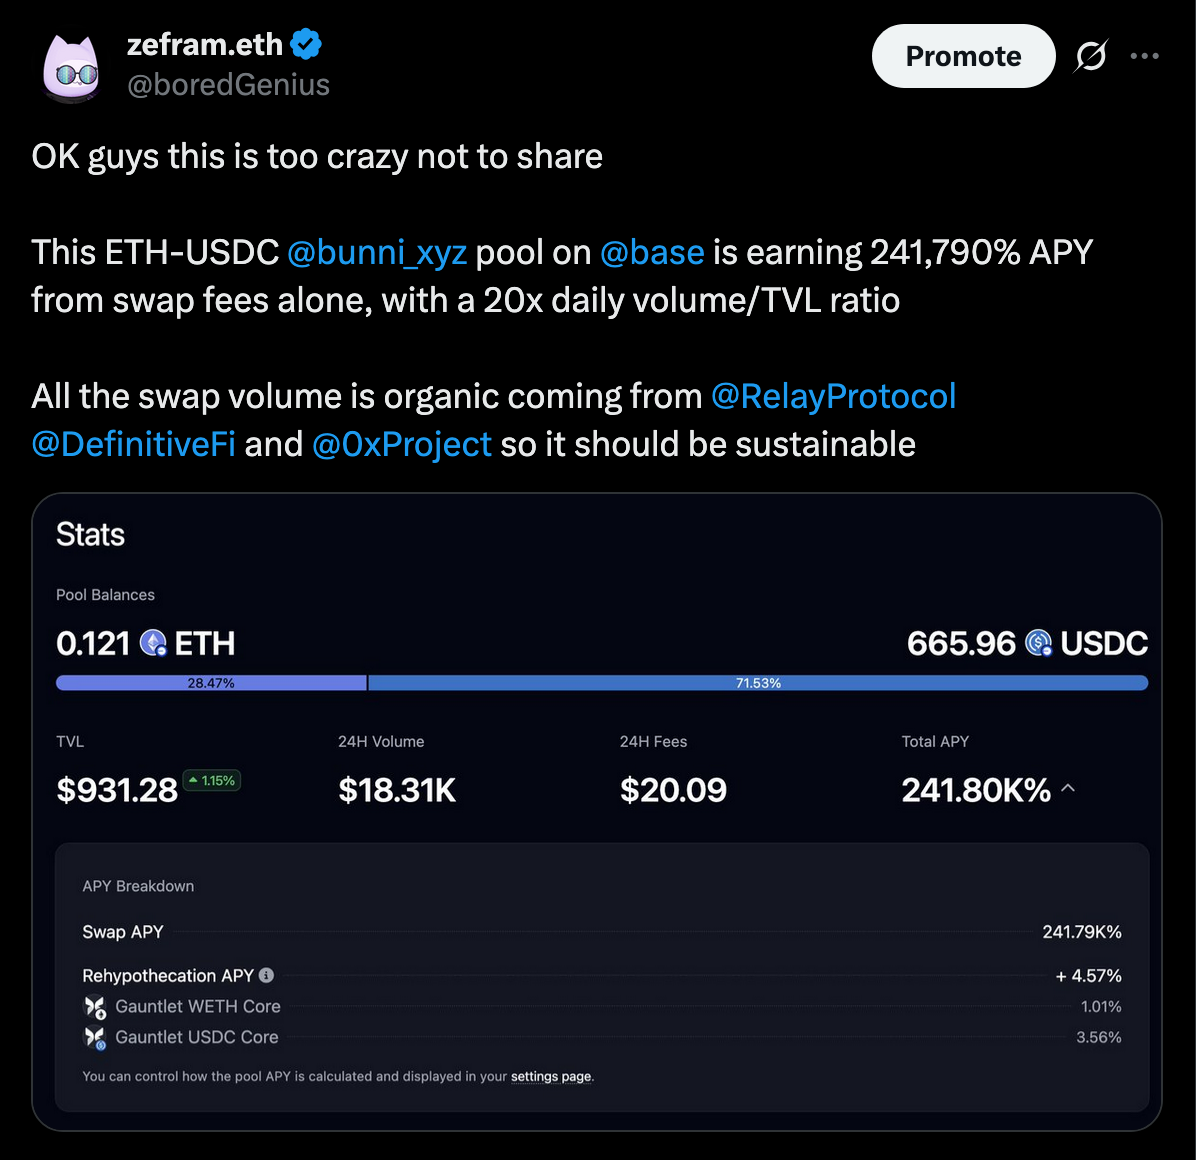
Somehow it was earning 241 thousand percent APY in swap fees! What was going on?
I started looking though the swap transactions, and it appeared that we started getting a lot of orderflow from 0x, Relay, CowSwap, and Definitive. Our team’s initial hypothesis was that the crazy volume done by this pool was caused by the newly added orderflow, and that the pool’s incredible swap fee revenue was simply the natural state of things after everyone integrated with Bunni liquidity. We were quite excited, because prior to this our main problem was having too little orderflow due to many DEX aggregators being slow and/or unresponsive with integration as well as many technical challenges related to our use of rehypothecation. This new orderflow felt like a game-changer.
Thus, we decided to incentivize and promote an ETH/USDC pool with similar parameters. It quickly started getting traction, likely due to the high swap fee APY, and liquidity reached around \$1 million. We thought we may have cracked the code to LP profitability.
But of course, that’s when things started going south. Reports trickled in from our users that their position value seemed to be going down, and our own test positions in the pool showed the same decrease. Long story short, the pool was getting arbitraged to hell due to its overly concentrated liquidity, and the liquidity was also shifting far too quickly since it was centered around the 3-hour TWAP (time-weighted average price) which caused it to lock in its impermanent loss when the price moved.
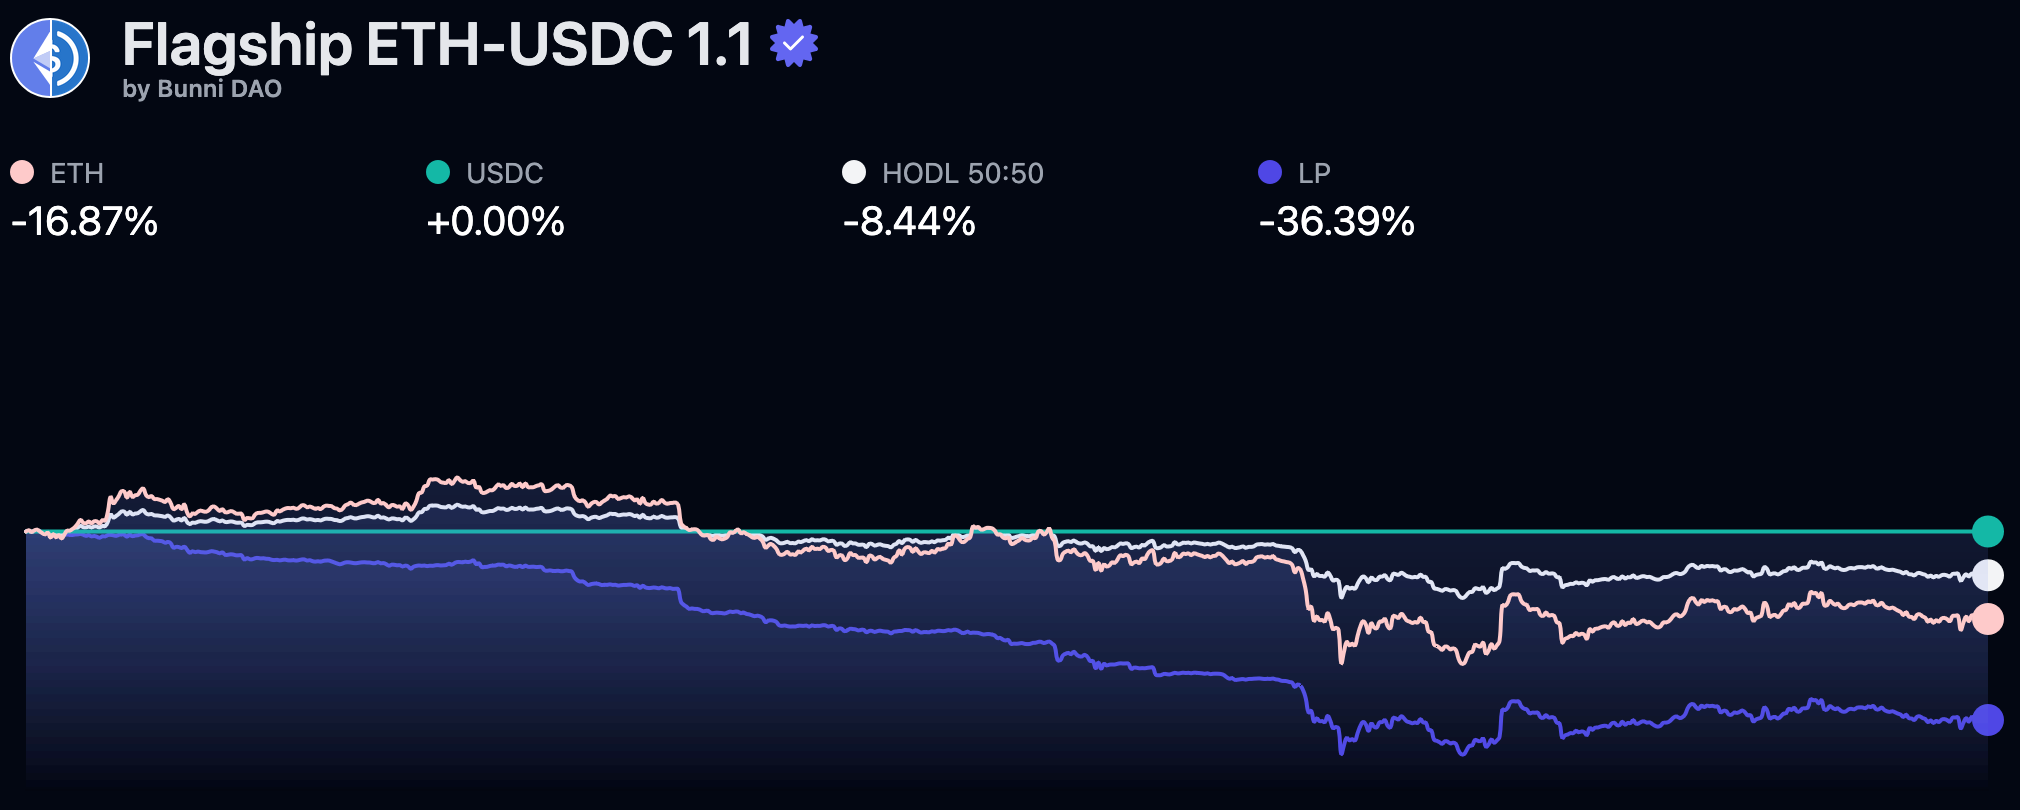
We quickly built performance tracking into the website which you can see in the above image. Since the pool was created, the price of ETH decreased by 16.87%, but the value of the liquidity position decreased by 36.39%! This was really, really bad.
We realized our mistake and developed a data analysis framework that allowed us to monitor how Bunni pools were performing and compare them against analogous Uniswap v3 pools.
Methodology
We started analyzing two important metrics: markouts, which represented the profit/loss of a pool from the swaps it processes, and volumes, specifically where swaps were coming from and if they were coming from retail users or MEV bots. You can check out the source code here. I’ll show you the results for the disaster pool, and then go into the methodology.
(If you don’t care abourt the technical nitty-gritty, feel free to jump to our experiments.)
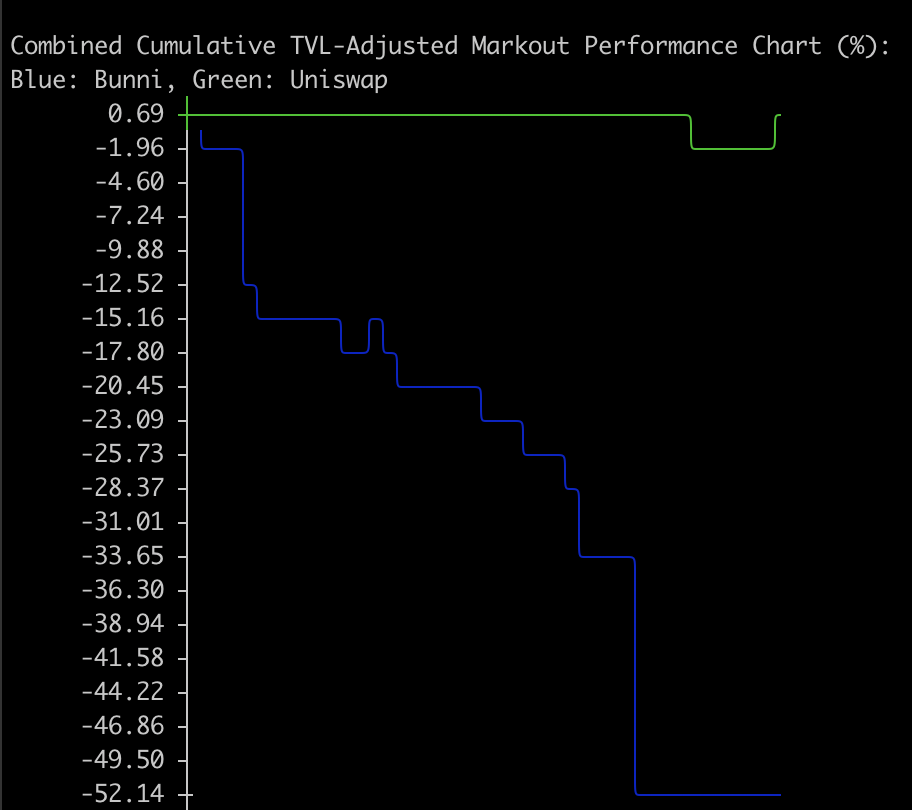
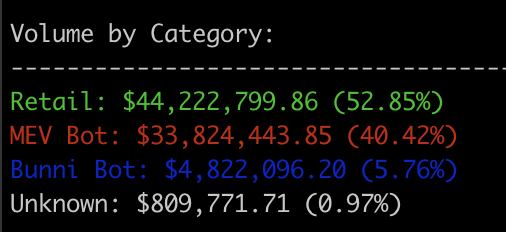
Not great. The pool rapidly lost value, as can be seen from the huge negative markouts, and over 40% of the total swap volume was from MEV bots.
Markouts
What are markouts?
In short, each swap a pool receives decreases its balance in one asset and increases its balance in the other asset, and the markout of the swap is essentially the profit/loss of the pool from that swap measured at some time in the future (or past). For example, if someone sold 1 ETH for 1600 USDC with a pool, and the price of ETH 5 minutes after the trade is \$1500, then the markout of that swap would be:
$$ markout = \Delta ETH \cdot p^{+5min}_{ETH} + \Delta USDC \cdot p^{+5min}_{USDC} = 1 \cdot 1500 + (-1600) \cdot 1 = -100 $$When the markout is taken a short time before/after a trade, the markout mostly measures the LVR (loss-versus-rebalancing) of the trade which corresponds to losses to arbitrageurs. If Binance was selling ETH at \$1500 while the Bunni pool was buying ETH at \$1600, then the trader made a profit of \$100 by arbitraging between Binance and Bunni.
We decided to take a slightly different approach for measuring markouts. We were not simply interested in LVR, we also wanted to capture the performance of the pool’s longer-term strategy. Bunni pools can modify their liquidity positions automatically based on some predefined strategy, for example one common strategy is to center liquidity around the TWAP value or some other oracle value (e.g. Chainlink). Bunni pools can also auto-rebalance when the asset ratio becomes imbalanced, which would broadcast a swap intent and effectively let the pool swap against external liquidity. Using short-term markouts will not be able to capture the performance of such strategies.
Therefore, we decided to use end-of-day markouts. When computing the markout of a swap, instead of using the asset prices some constant time into the future/past (+5 minutes in the example above) we use the prices at the end of the day (in UTC). The markout of a particular day would be the sum of the end-of-day markouts of the swaps that happened during the day. The expected LVR value would still be a component of this markout, and the performance of the liquidity management strategy would be captured as well.
Using the previous example, say that at the end of day the price of ETH actually went up to \$1700, then the EOD markout of that swap would be:
$$ eodMarkout = \Delta ETH \cdot p^{EOD}_{ETH} + \Delta USDC \cdot p^{EOD}_{USDC} = 1 \cdot 1700 + (-1600) \cdot 1 = 100 $$In this case, the pool made a poor short-term decision but a great long-term decision.
We also wanted to compare the markouts of Bunni pools with other exchanges, but different exchanges have different amount of liquidity provided, so we needed to adjust markouts by the liquidity amount. The adjusted markout of a swap is simply its EOD markout divided by the TVL (total value locked) of the pool at the time of the swap. In the example above, if the TVL of the pool was \$10k when the swap occurred, the swap’s TVL-adjusted markout would be:
$$ tvlAdjustedMarkout = \frac{eodMarkout}{TVL} = \frac{100}{10000} = 1\% $$For each day, we can sum up the TVL-adjusted markouts of all the swaps that happened during the day to compute the TVL-adjusted markout of the day. TVL-adjusted markouts enable us to compare the performance of different DEXes with different amounts of TVL.
We also made the decision to omit the markouts from the first day after the inception of a Bunni pool. This is because when a Bunni pool is initialized there is likely an initial arbitrage that brings the price of the pool from its initial value to the true market price. It’s a result of our pool creation interface: the spot price is manually set at the beginning of the 5-10 minute process, meaning when a pool is deployed onchain at the end of the process the price has likely moved away from the initial value. We’re working on an improved pool creation flow that will largely solve this issue.
Volumes
Having a high swap volume is not necessarily good, evident from our disaster pool that did crazy amounts of volume but still lost money every day. Where the volume comes from matters. Volume from MEV bots extract value from LPs, while volume from retail sources like 0x, CowSwap, Uniswap, and Relay do not (on average). The more retail volume a pool has, the easier it is for LPs to profit.
We’ve manually catagorized a decent number of addresses on Ethereum Mainnet and Base that account for >99% of total volume. We’ve assigned labels to them (e.g. CowSwap, Universal Router) and catagorized them as either “Retail” or “MEV Bot”. You can see the list of addresses and labels here. We also catagorized “Bunni Bot” separately, which is an arbitrage bot that our team is running which returns the MEV to LPs via our am-AMM mechanism.
Experiments: Round 1
After observing that the disaster pool was performing horribly, we created three experimental ETH/USDC pools with varying parameters.
- Experiment A: The base configuration with:
- a wide liquidity distribution (supports price movements between [-33%, +49%])
- slow shifting/rebalancing (liquidity centered around 48-hour TWAP).
- Experiment B: Fork of A with:
- a narrower liquidity distribution (supports price movements between [-18%, +22%])
- slower shifting/rebalancing (liquidity centered around 120-hour TWAP)
- Note: we should have only changed one parameter from A here but the observations still stand since
- Experiment C: Fork of A with:
- more aggressive dynamic fee parameters, such that when the spot price deviates from the 24-hour TWAP the swap fee increases more quickly
We compared the TVL-adjusted markouts of these pools with the Uniswap v3 ETH/USDC 0.05%-fee pool. We also analyzed the volume sources of these pools and the Uniswap v3 pool. Here are the results.
Markout observations
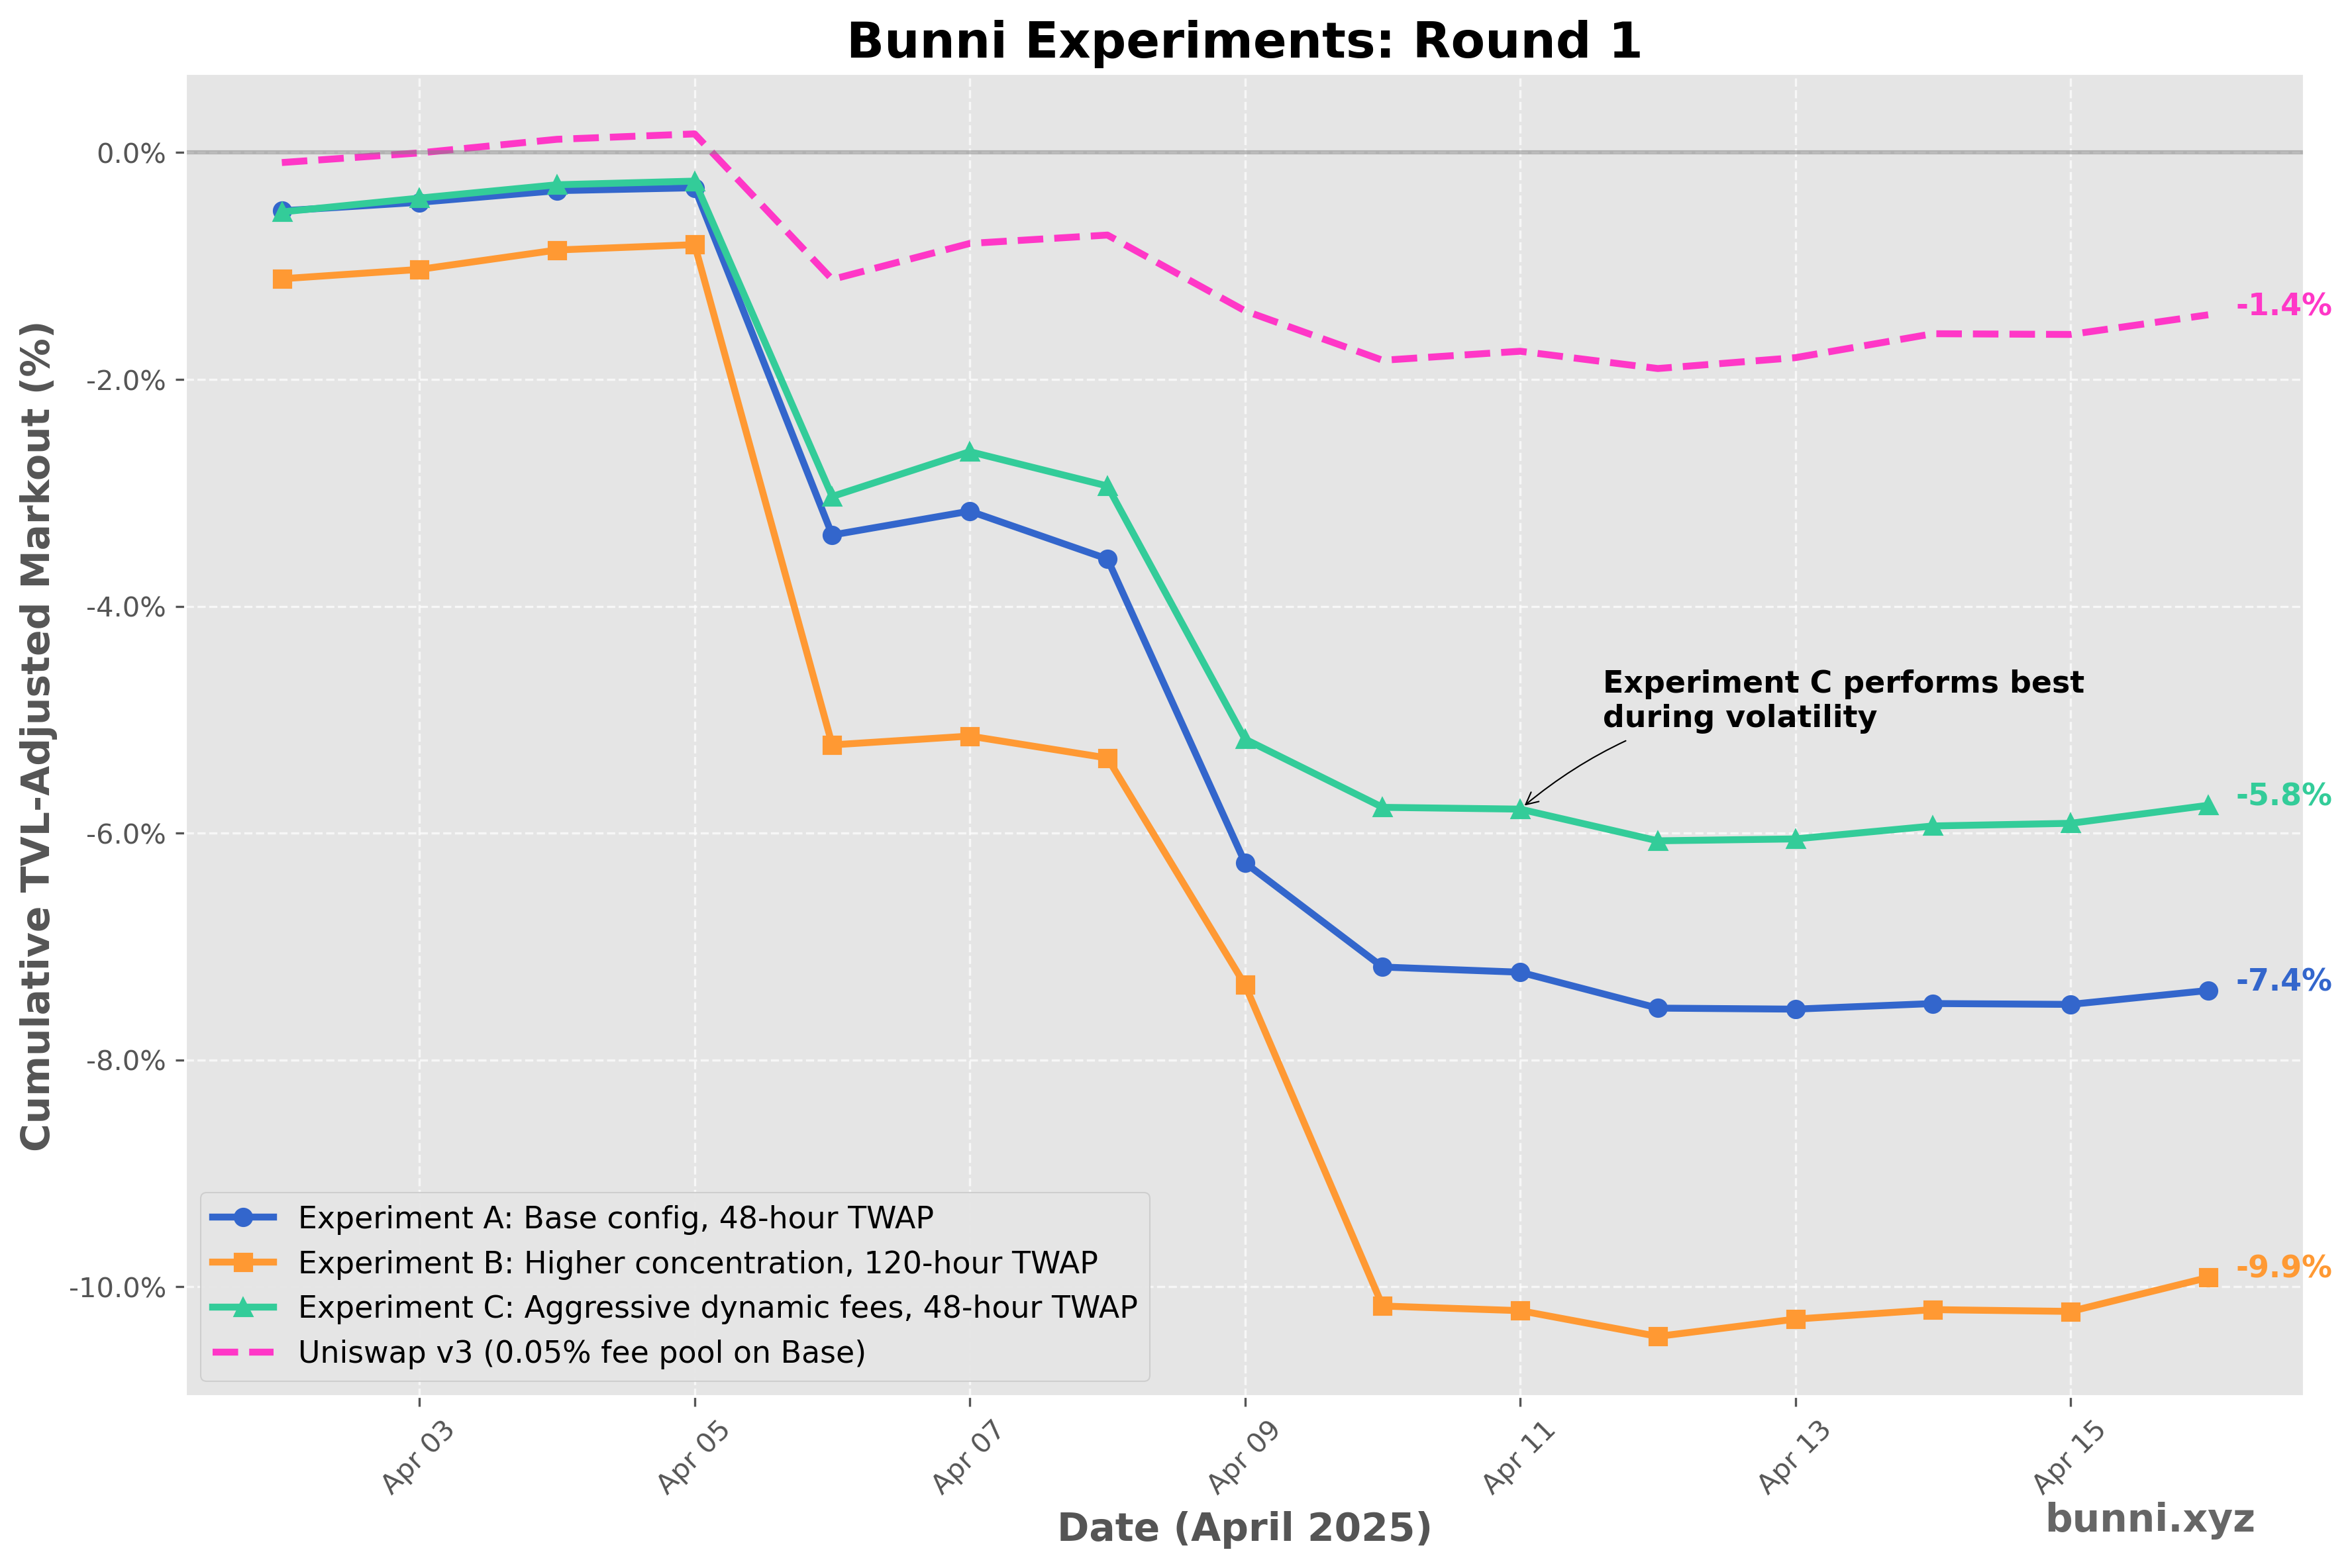
- Performance ranking: Uniswap > C > A > B
- All three Bunni pools performed significantly worse compared to the Uniswap pool.
- All pools performed much better compared to the disaster pool, validating our hypothesis that the negative markouts were due to the high liquidity concentration & fast shifting/rebalancing.
- Experiment C performed better than the other two pools on most days, and in particular on days with high volatility (4/6, 4/9, 4/10) C performed consistently better. This shows that more aggressive dynamic fees can improve markouts.
- Experiment B performed much worse than the other pools, especially on days with high volatility. This shows that higher liquidity concentration causes pools to lose a lot of money in volatile times.
Overall, this first round of experiments showed us that dynamic fees seems to be the direction towards better LP profitability.
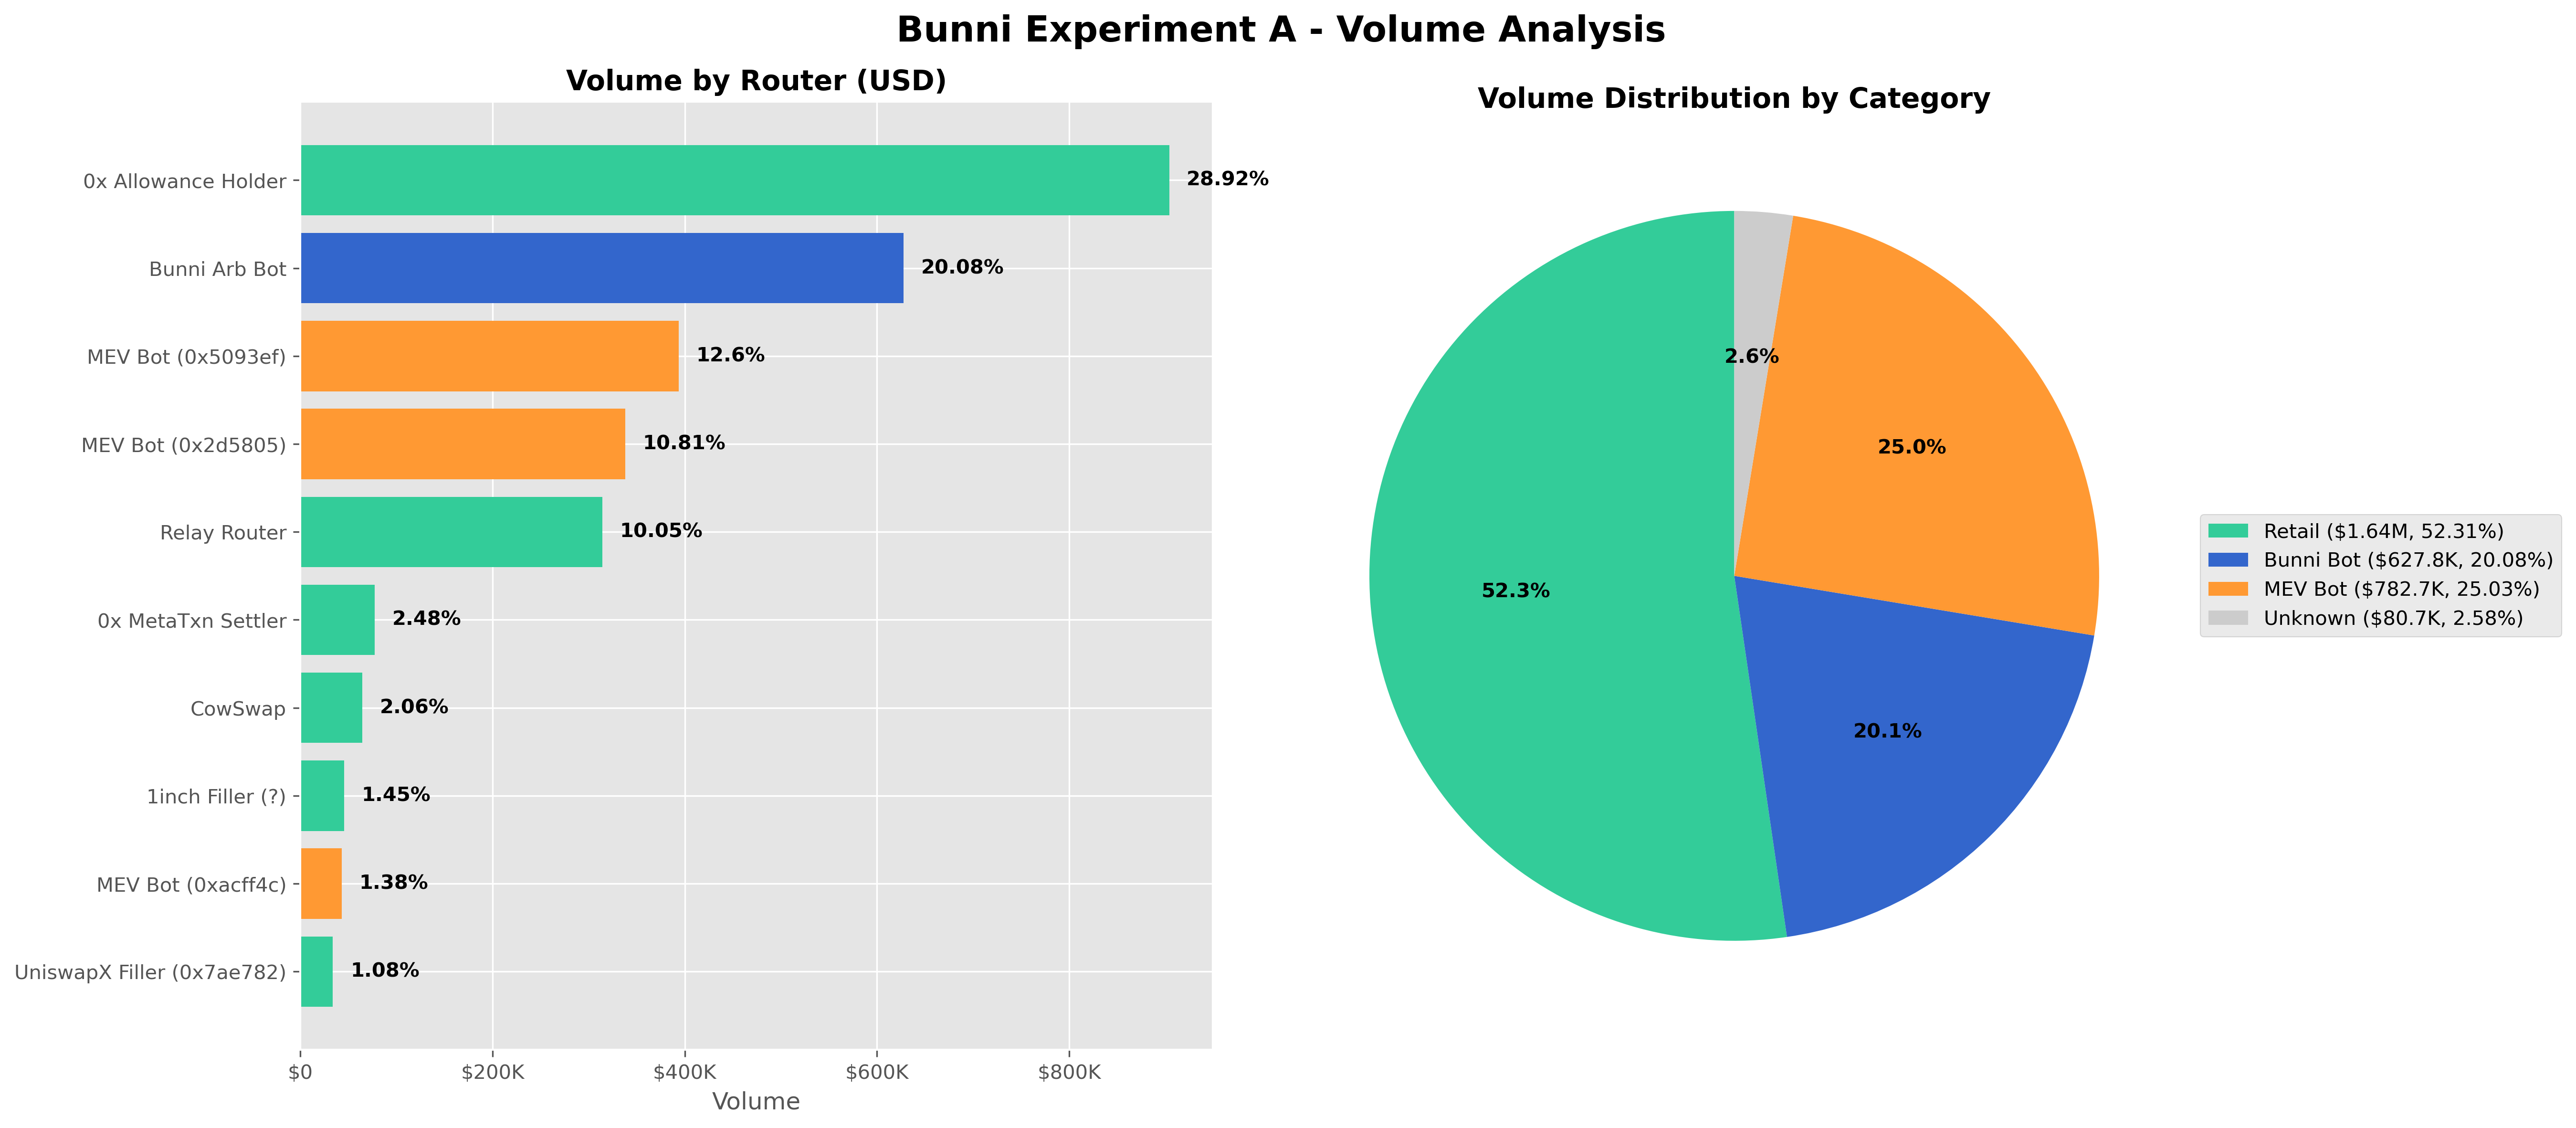
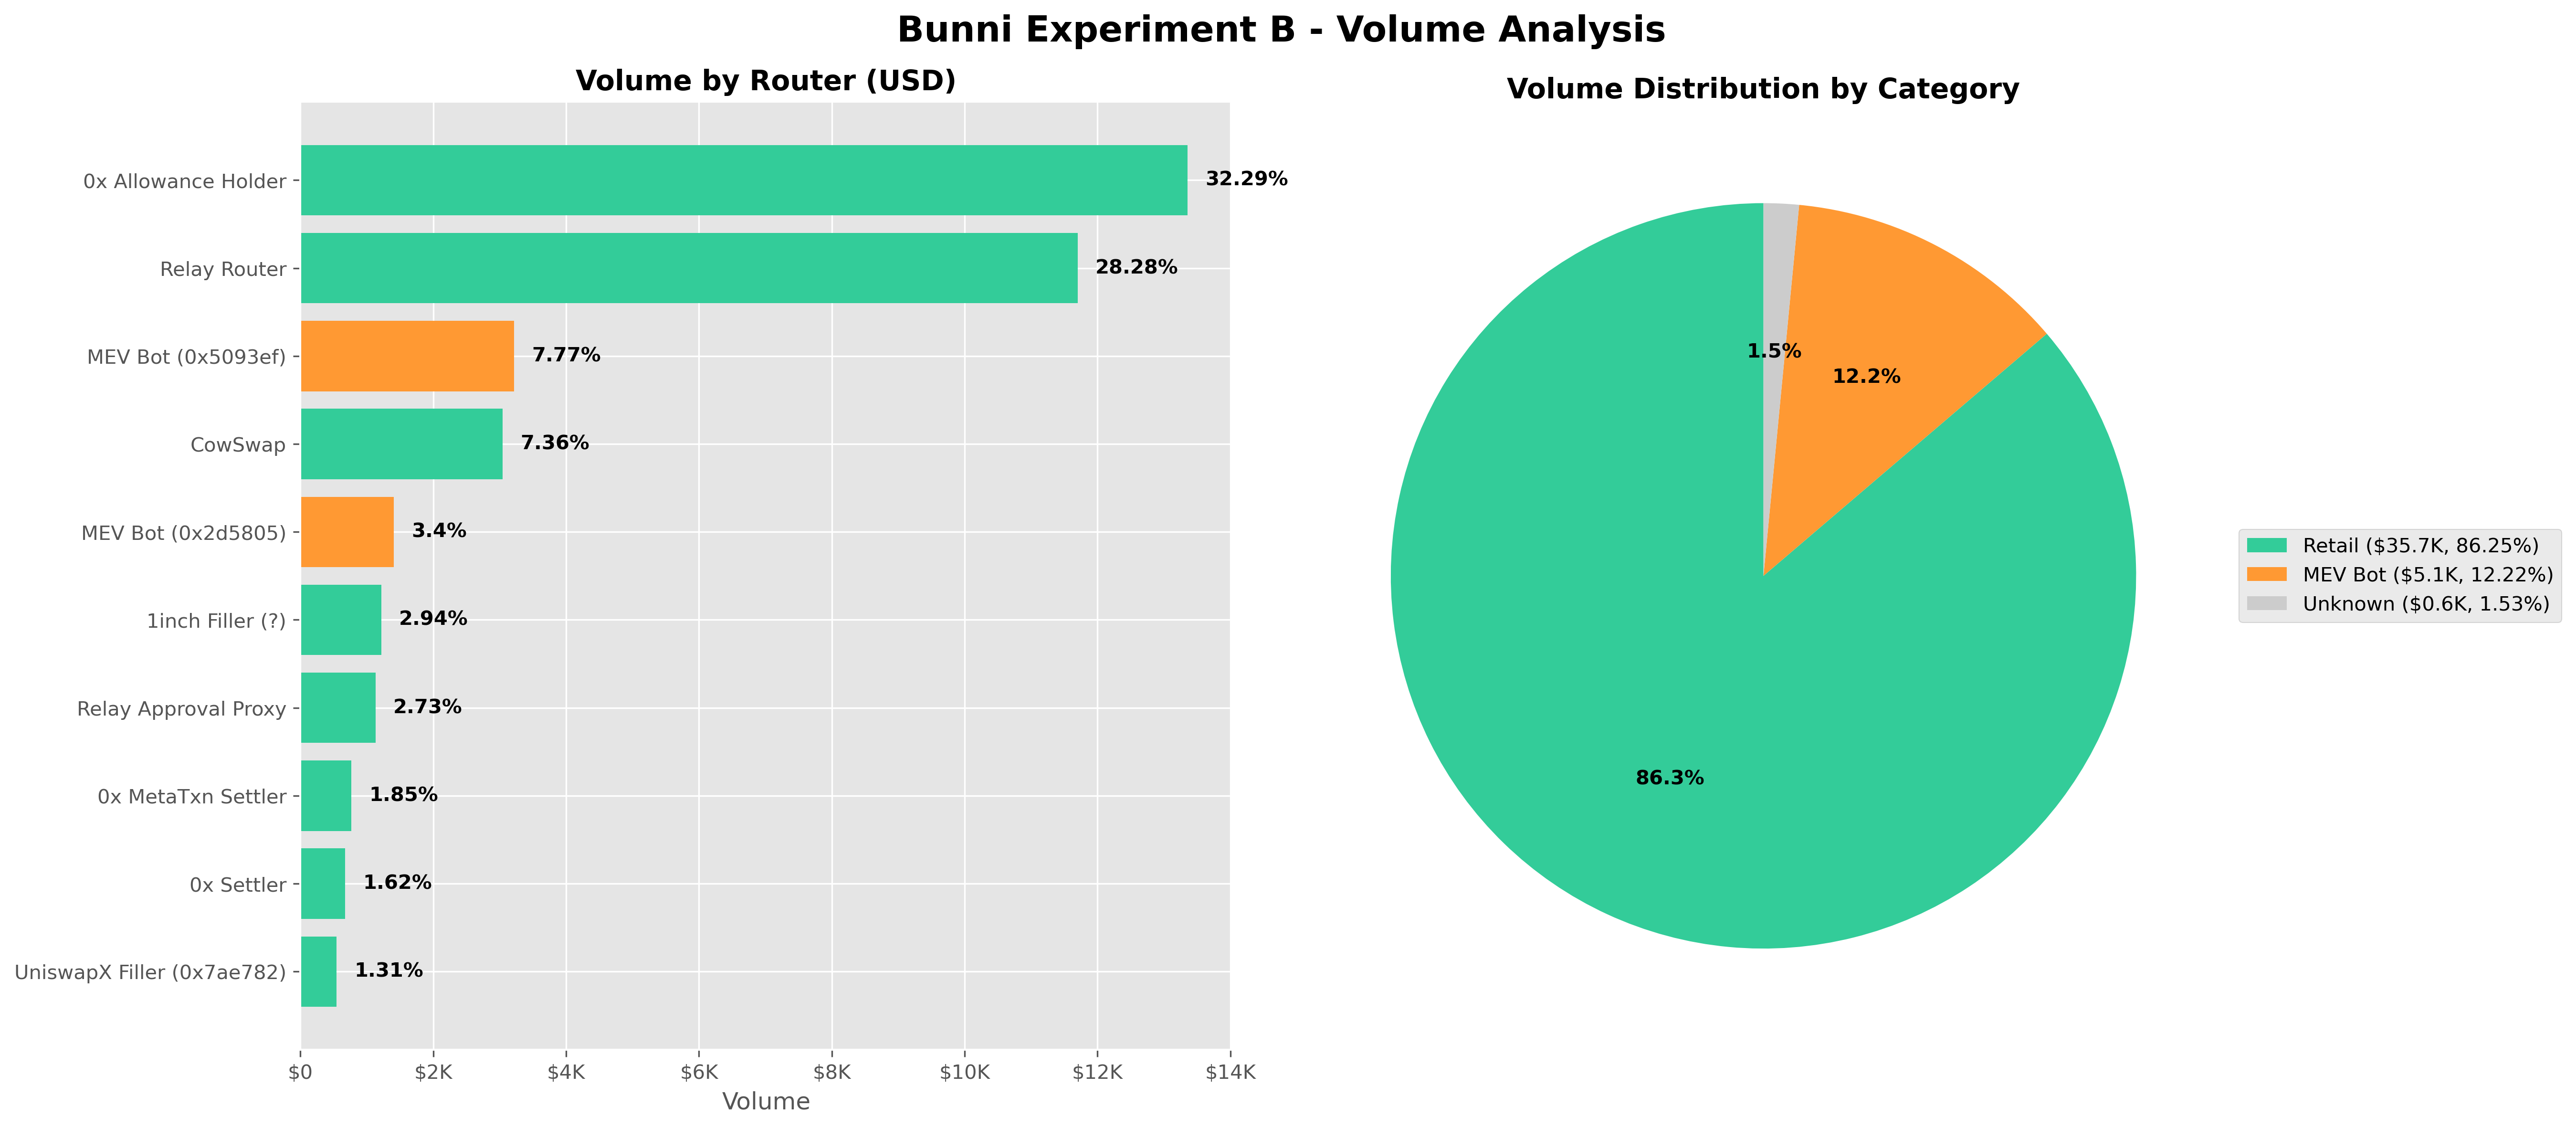
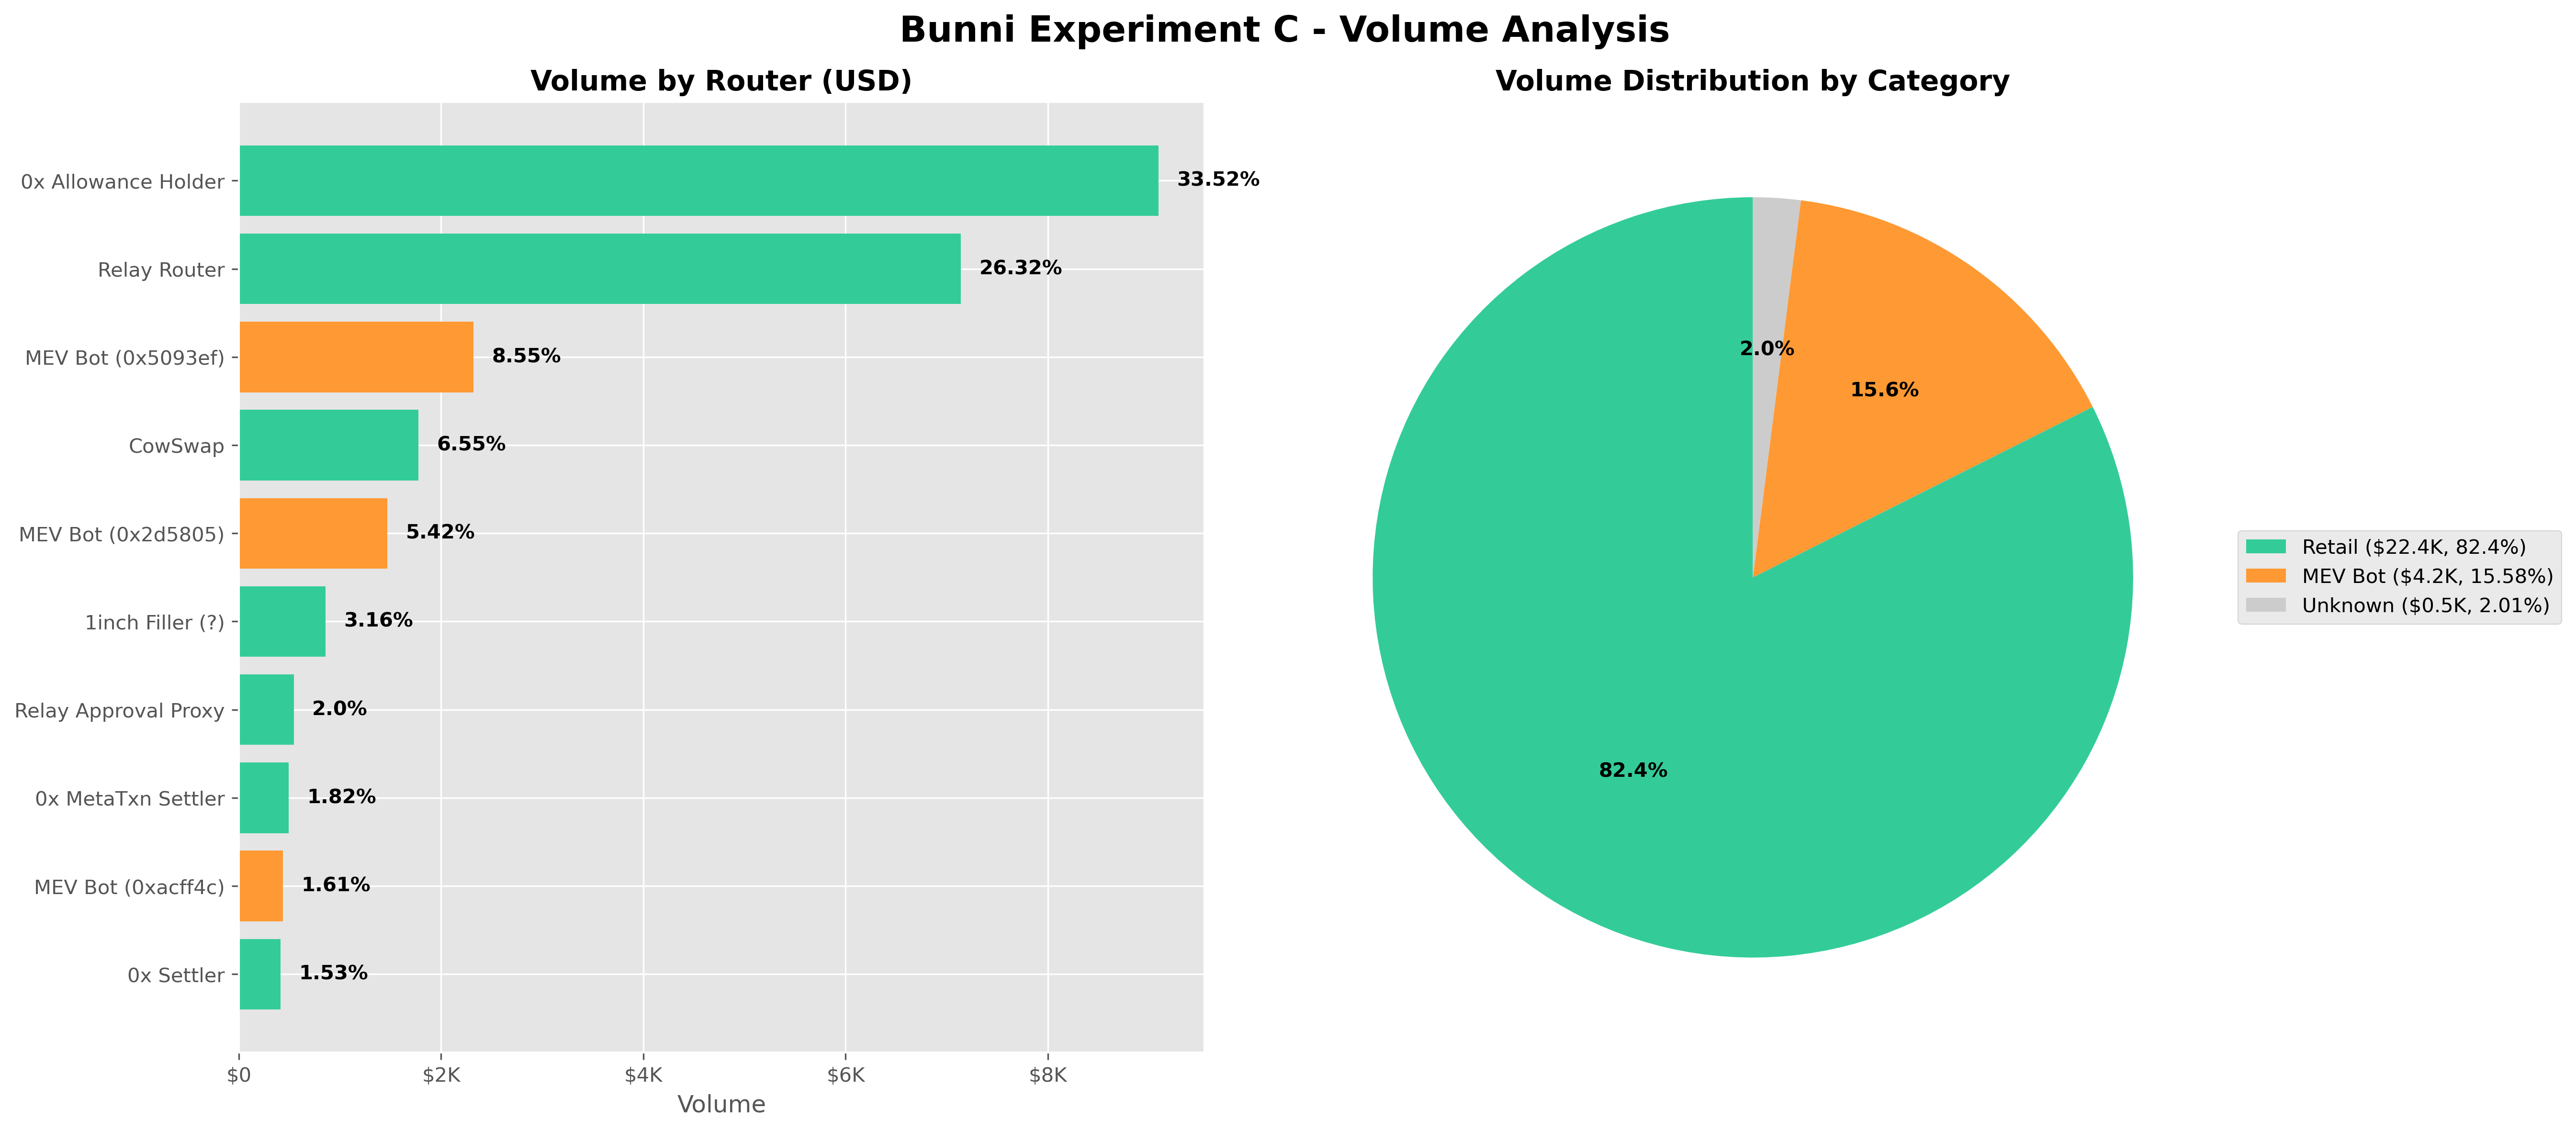
Volume observations
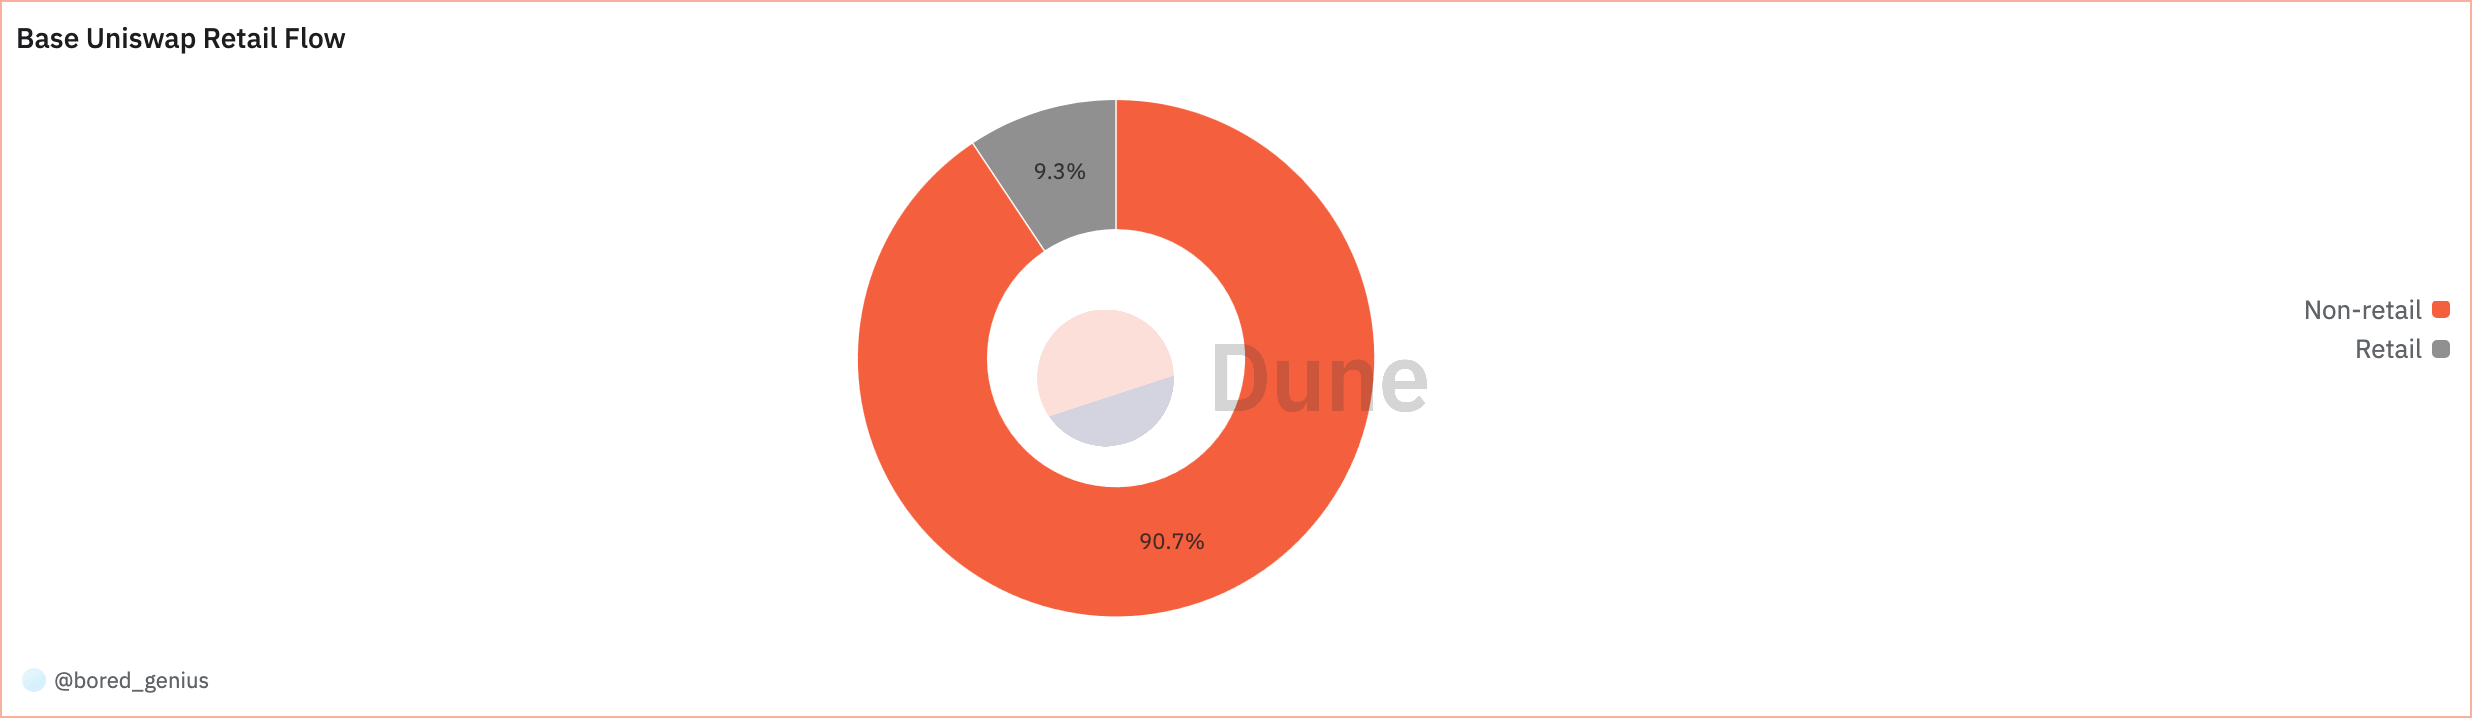
- Retail volume makes up a significantly larger portion of Bunni volume vs Uniswap v3.
- Bunni: >75% Retail
- Uniswap v3: 9.3% Retail
- Bunni’s orderflow comes from a diverse set of sources: 0x, Relay, CowSwap, 1inch, UniswapX…
These results are quite promising. If the orderflow quality of Bunni is high, then it should theoretically be possible for LPs to consistently profit.
Bunni
Uniswap v3
We used a Dune query instead of our custom framework to categorize the volume of the Uniswap v3 ETH/USDC pool due to the large number of swaps. Here’s the result over the same time period:
Experiments: Round 2
From experiments ABC it’s clear that more aggressive dynamic fee params lead to better markouts.
Experiment C had an 18-hour period where the swap fee was maxed out at 2%, during which time swaps were still happening, so we hypothesized that a higher max swap fee will allow pools to capitalize on volatility better. We also hypothesized that an even more aggressive dynamic fee increase will further improve markouts.
- Experiment D: Fork of C with:
- Higher maximum dynamic swap fee (10%)
- Experiment E: Fork of C with:
- Longer dynamic fee TWAP window (higher fees last longer)
- Experiment F: Fork of C with:
- Higher maximum dynamic swap fee (10%)
- 4x faster dynamic fee increase
We’ve omitted the volumes data because it’s similar to experiments ABC with a high portion of retail volume.
Observations
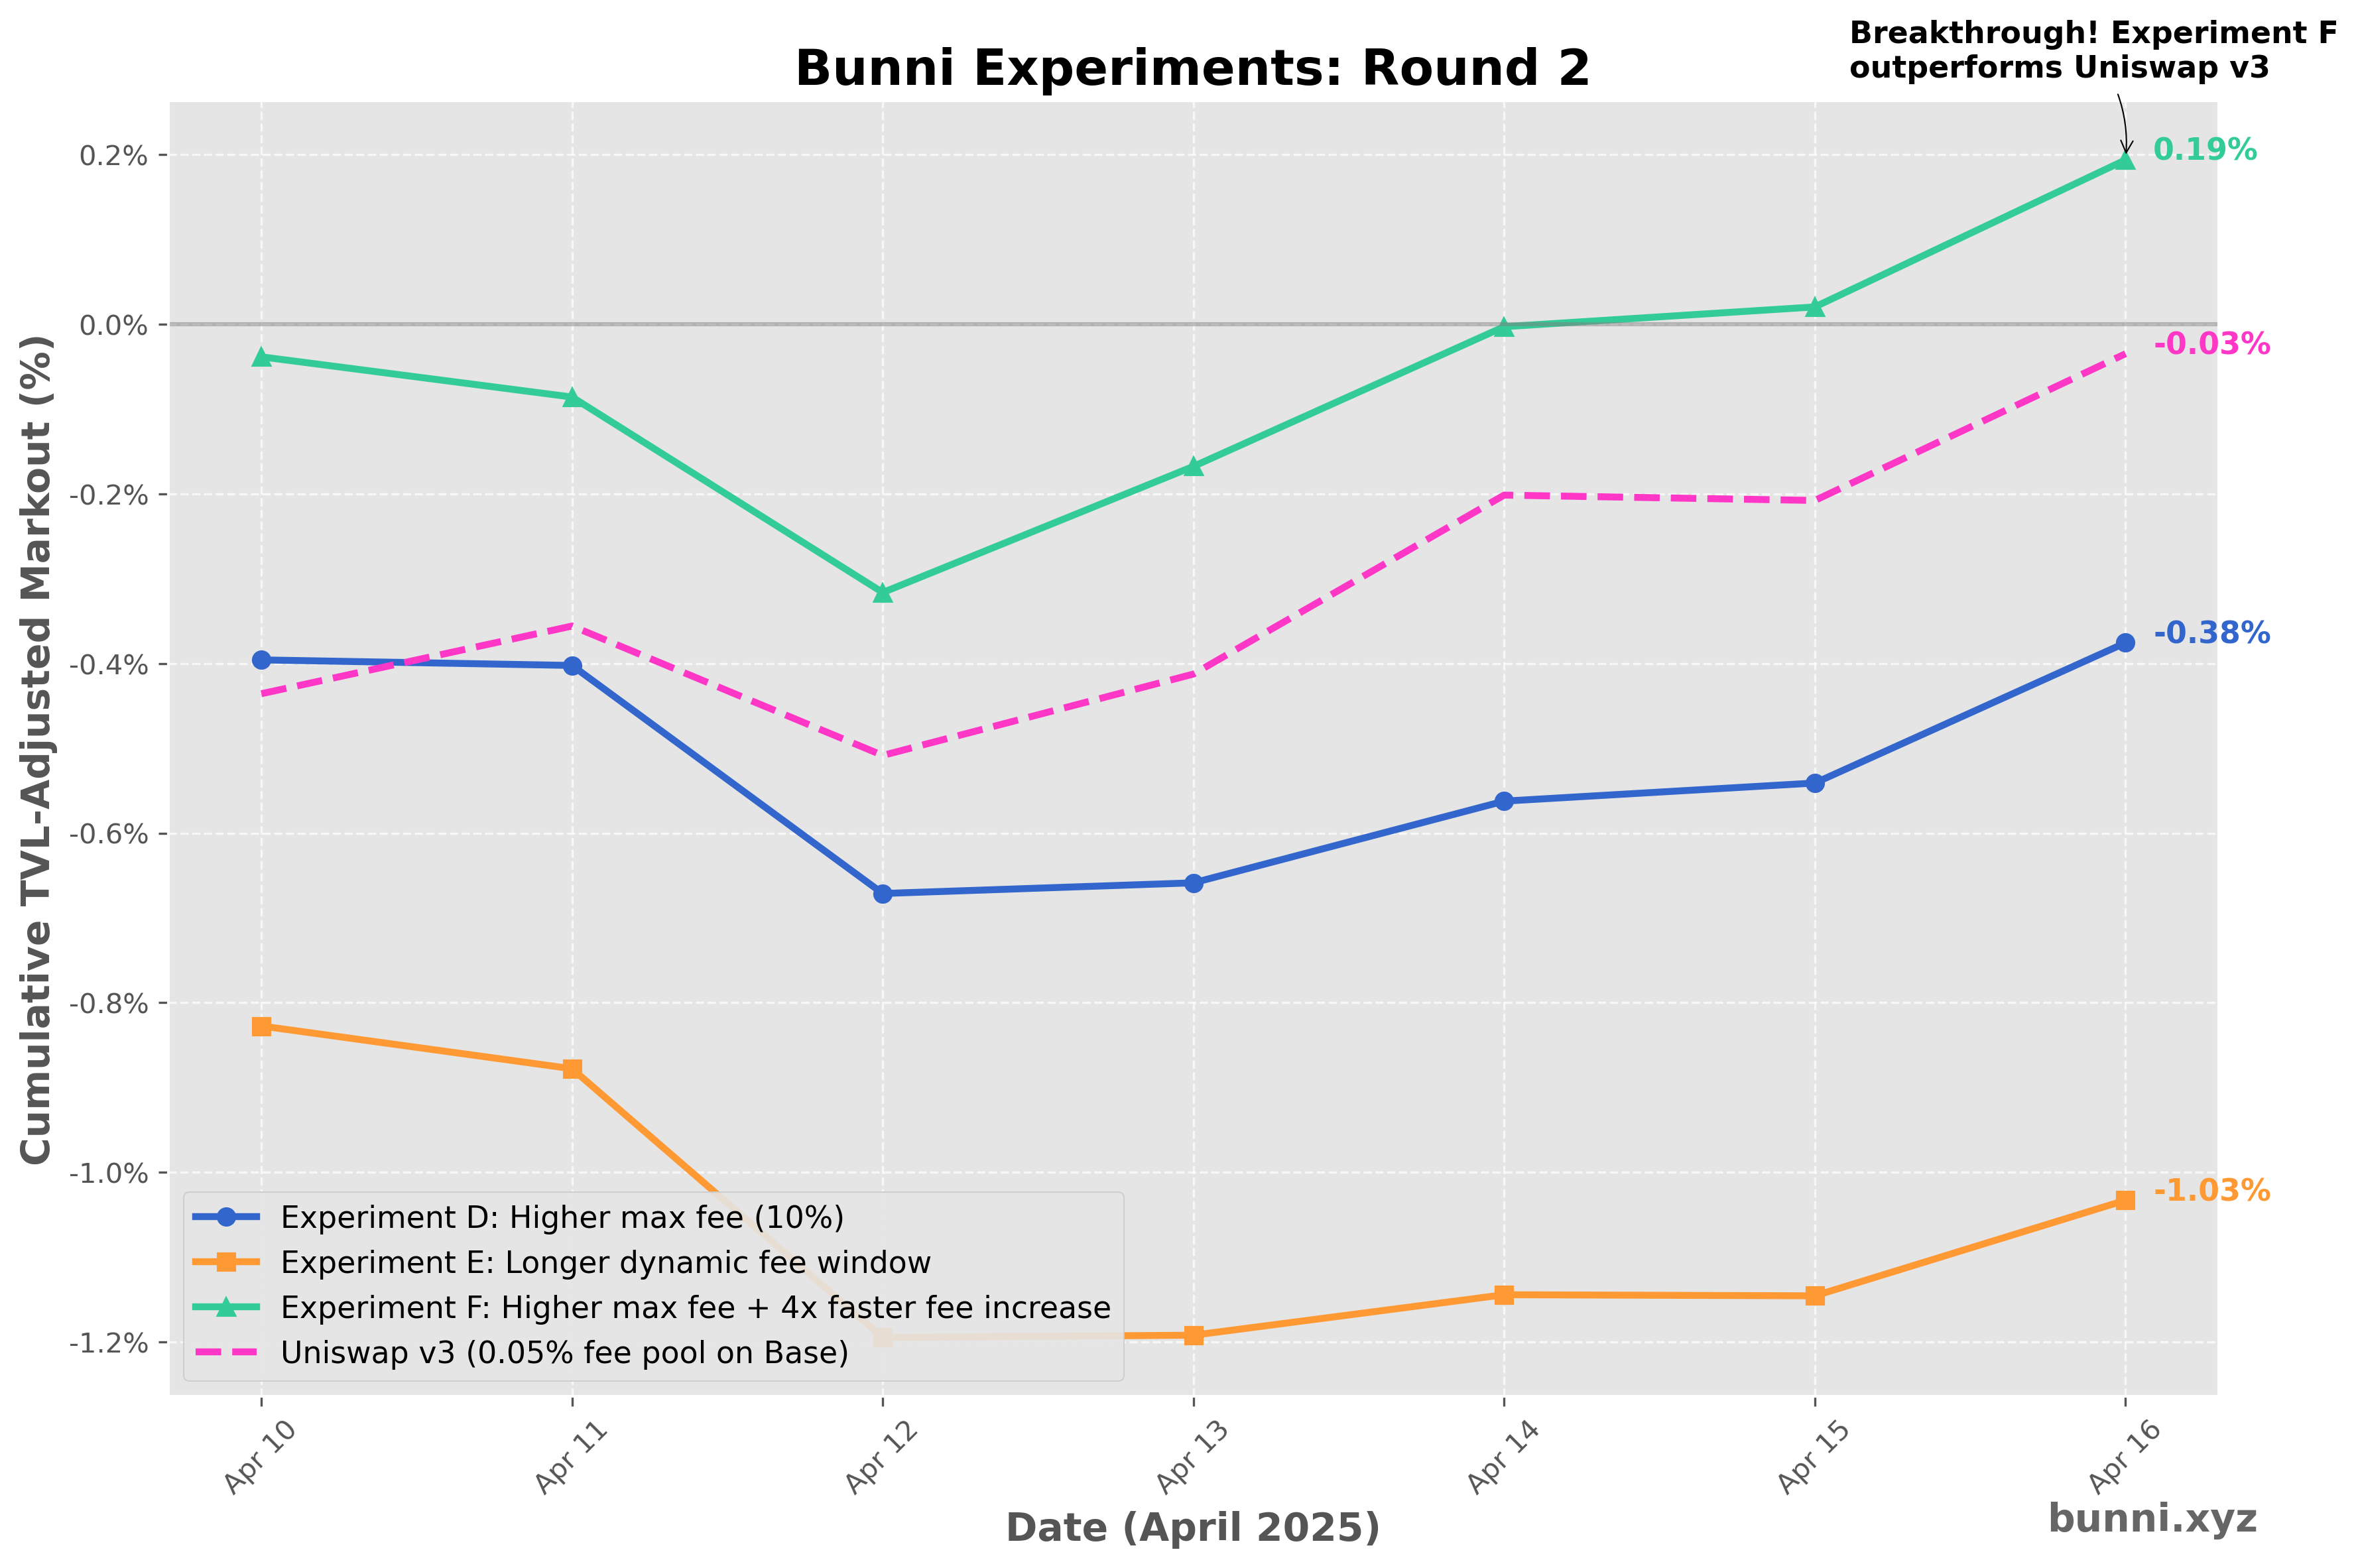
Jackpot!
The most eyecatching data was from Experiment F. The TVL-adjusted markouts appear to be better than, or at least on par with, the Uniswap v3 pool!
This is particularly impressive when you consider the fact that the Bunni pool is passively managed while the Uniswap v3 pool is being actively managed by actual humans. It’s a resounding affirmation of our hypothesis that more aggressive dynamic fees lead to better performance. We’re frankly surprised at how well the dynamic fee model is working given its simplicity (see our docs for a detailed description). We think its rapid response to volatility is key to its effectiveness: if an arbitrage swap tries to quickly push the price away (e.g. to the Binance price), Bunni’s dynamic fee instantly increases for that swap and subsequent swaps which should be able to ameliorate the impact of arbitrageurs.
Results from Experients D and E are also interesting. Experiment D performed better than Experiment C during the same time period, while Experiment E performed worse. It would seem that simply increasing the max swap fee by itself also improves markouts, suggesting that in Experiment C the arbitrageurs likely would’ve accepted a higher swap fee for their arbitrage swaps. We’re not quite sure why Experiment E performed so much worse, our best guess being that keeping the swap fee high when volatility has already died down prevents retail swappers from swapping with the pool, which decreases the swap fee revenue and thus markouts.
The direction for future experiments is clear: more aggressive dynamic fees lead to better markouts (likely up to a point).
One more thing…Uh oh
Even though the data from Experiment F is promising, we weren’t naive enough to think that we already solved LP profitability. For starters, we only had about a week of data, which is far from enough to show that the pool is actually profitable; for all we know, we could’ve just had a lucky week. After sharing our findings with our friends at the Uniswap Foundation, they pointed out that we should include markouts from rebalance swaps as well.
For context, when a Bunni pool updates its liquidity position, for instance shift to center around the market price, the assets can become imbalanced. Bunni pools can autonomously rebalance by broadcasting onchain swap intents, swapping the asset it has too much of for the asset it has too little of. It makes sense that this rebalance swap should also incur a markout since the intent’s filler is effectively swapping with the pool just like regular swappers.
After accounting for rebalance swaps in our framework, the results for Experiment F look substantially worse:
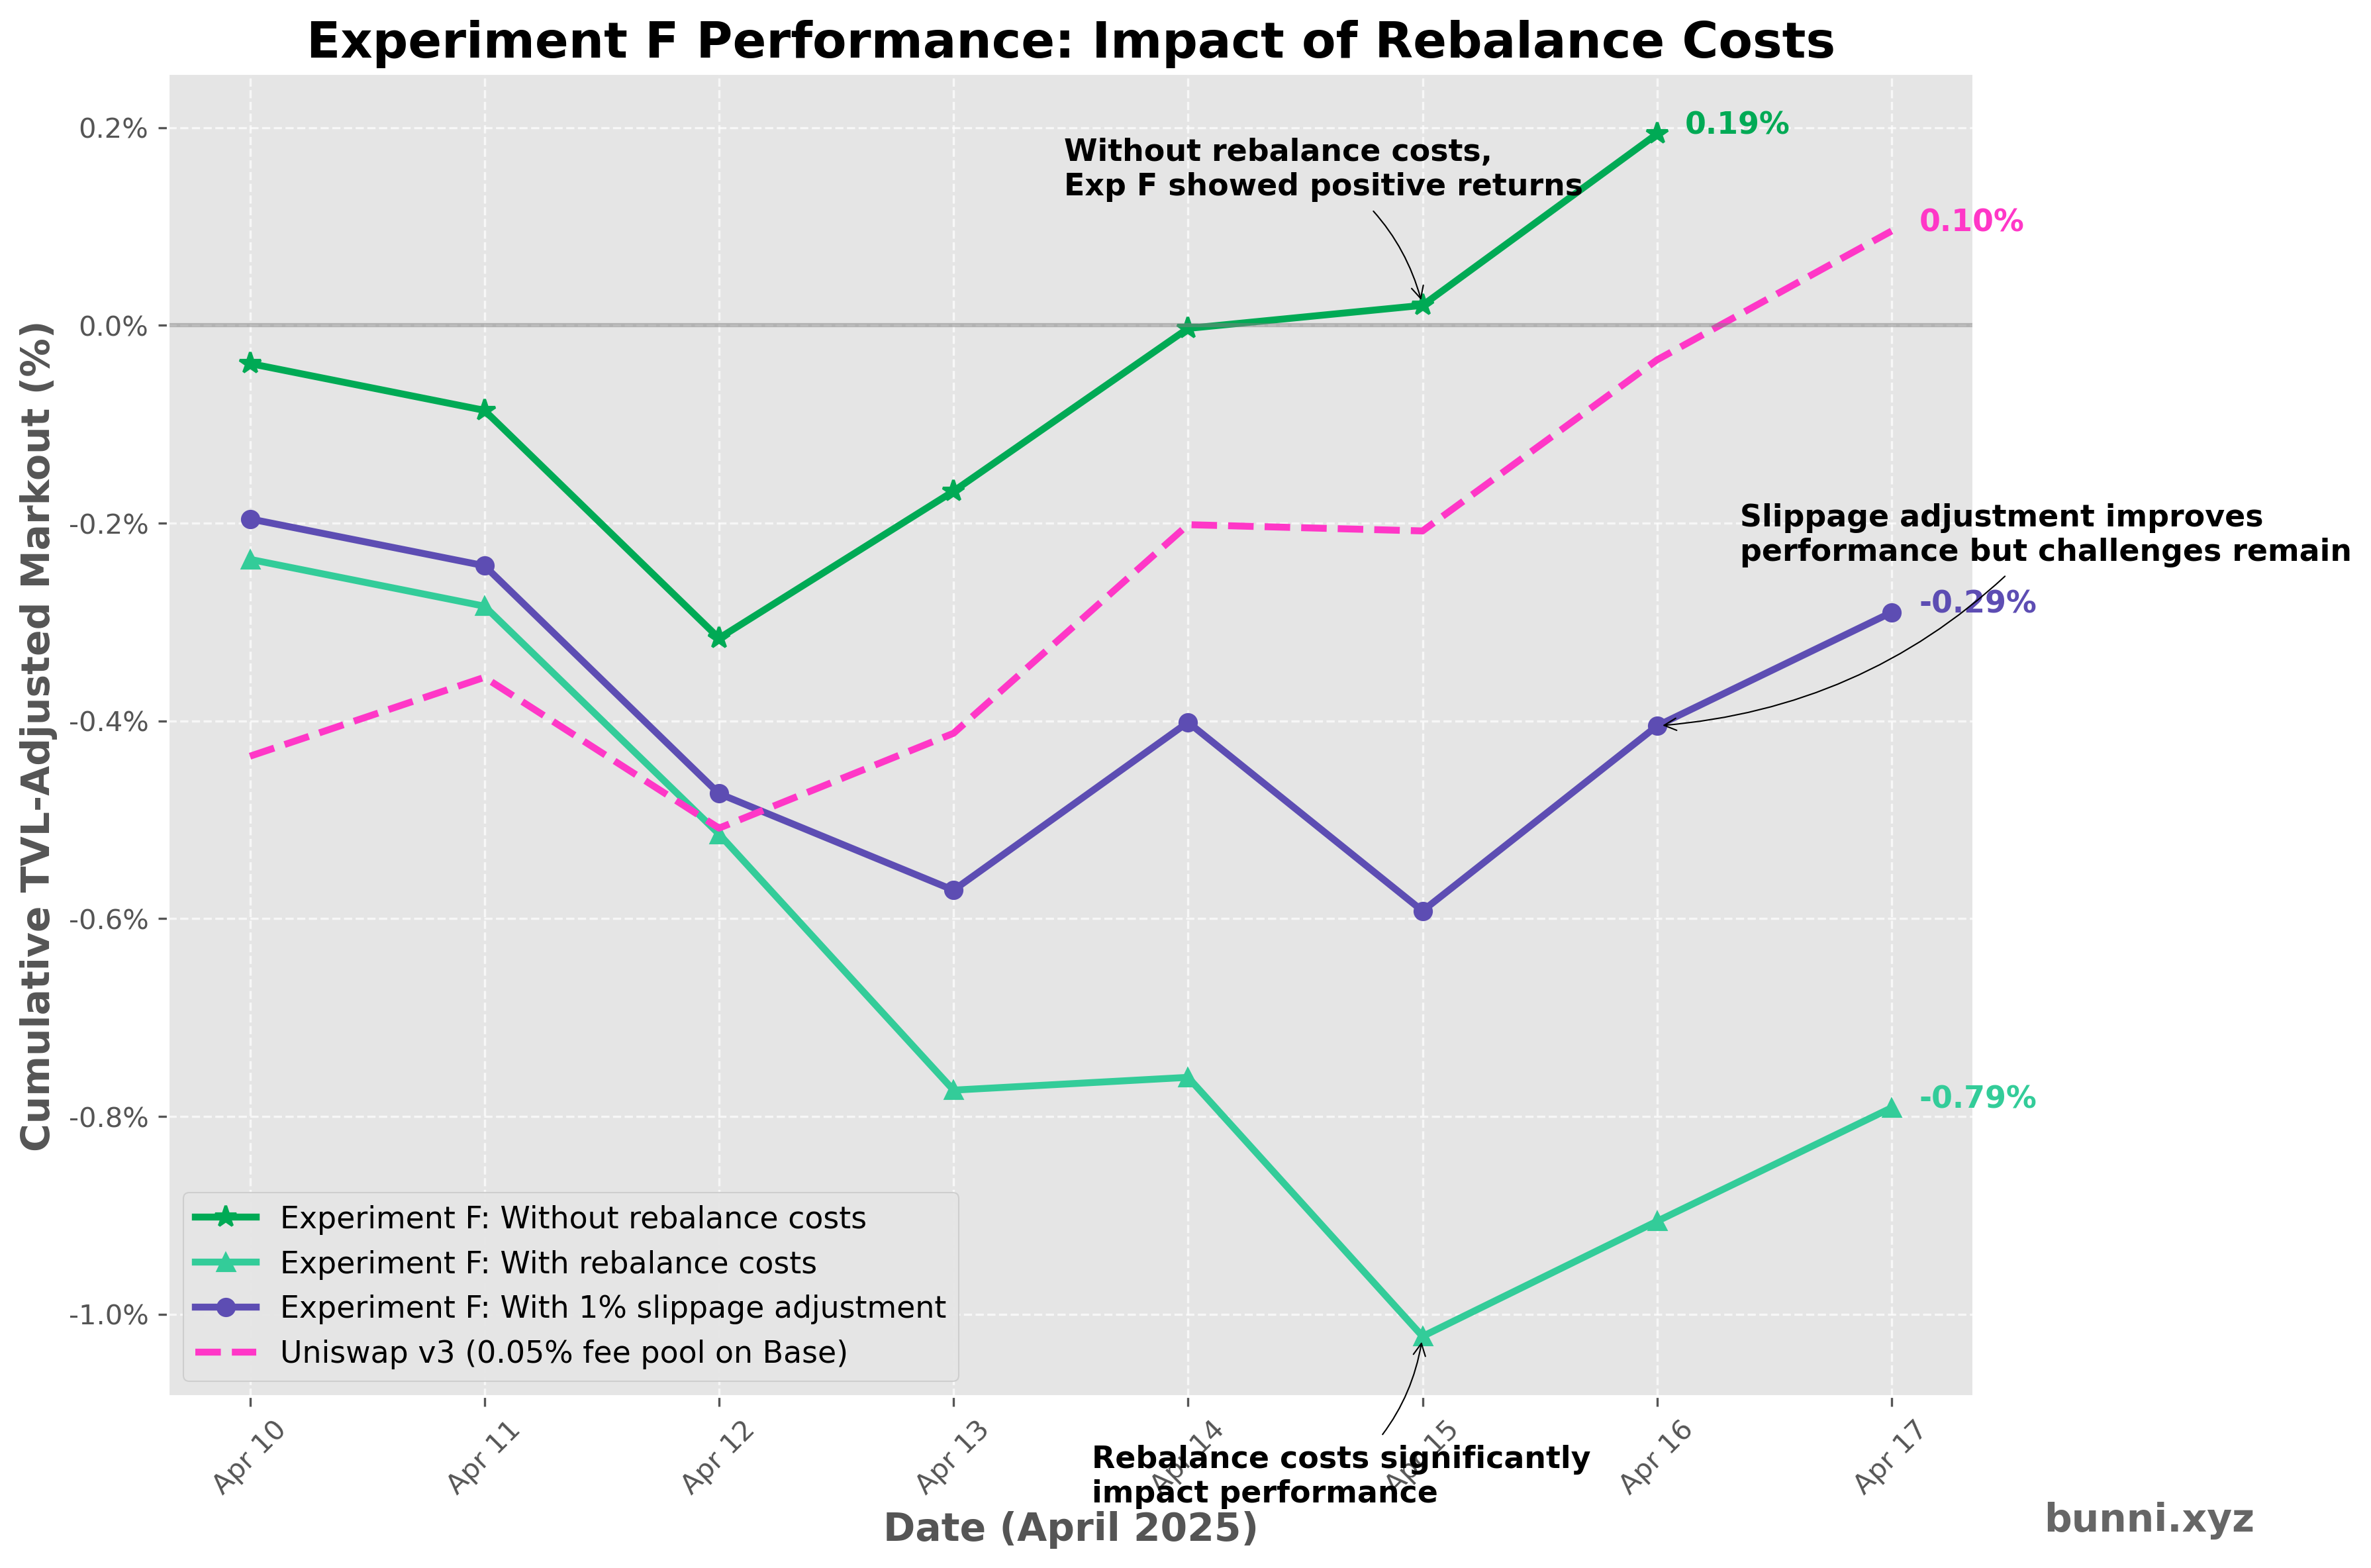
Markouts from rebalance swaps have been listed as a separate column. It would seem that the markouts from rebalances are all negative, often large enough to offset the positive markouts from regular swaps. I would like to point out that the comparison between Bunni and Uniswap v3 becomes less meaningful here because Uniswap v3 LPs also rebalance their positions manually but it’s nearly impossible to track the markouts from those swaps. But still, we want the overall markouts of Bunni pools to be positive, not just to outperform Uniswap v3 pools.
A quick look through the rebalance transacions show that pools are experiencing large slippages during the rebalance swaps. For example, look at this transaction:

The actual value of the ETH being sold by the pool was 889.94 USDC, but only 881.04 USDC was used to fulfill the rebalance swap. That’s almost exactly a 1% fee, which is insanely high.
At this point we’ve been using a third-party filler to fulfill Bunni’s rebalance swaps under an informal agreement that they will take a reasonably small fee from the swaps. As a result when we created Bunni pools we set the maximum slippage (compared against the TWAP) to 1% to prioritize rebalance orders having a high fill rate. It would seem that we were wrong: while the filler didn’t set the slippage to the max limit, it is pretty close to the max limit. As a result of this discovery, we built our own rebalance filler that will offer a much lower slippage which will be up and running soon. We will also reduce the max allowed slippage in new pools we create.
However, it seems that the problem isn’t just slippage. If we assume that the experienced slippage of rebalance swaps is 1% and scale up the fill amounts accordingly, the markouts improve but are still negative. This suggests that the shifting/rebalancing strategy of the experimental pools is not the best. For future experiments, we will test if slower shifting and higher thresholds for rebalancing will improve performance.
Other than rebalances, rehypothecation yield should also be included in markouts. Bunni enables idle liquidity to be deposited into external yield protocols such as Aave, Morpho, and Euler to earn extra yield, and this yield should be included in the markouts since we’re using them as essentially the daily PnL of the pool. We will support this in our framework in the future.
Conclusion
We’re honestly very, very close to making LPing profitable.
We know the direction to go in: more aggressive dynamic fees, slower shifting, less frequent rebalances, and better rebalance executions. We’re excited to do more experiments and monitor the results. Every day we would look at a new data point and marvel at the implications.
Once we make LPing profitable, we expect massive shifts in the DEX space. No longer will liquidity need to be perpetually incentivized, and DEXes relying on their token emissions to stay relevant will quickly fade away. Liquidity will be deeper, traders will get better execution, and DeFi will finally be sustainable.
We will continue to post the results of our experiments to this blog. Follow our X account to be notified when we make a new post, and go to bunni.xyz to monitor how our experiments are performing.
Appendix
Markout data
Experiment A
| Date | Bunni Markout (\$) | Uniswap Markout (\$) | Bunni TVL-Adj (%) | Uniswap TVL-Adj (%) |
|---|---|---|---|---|
| 2025-04-02 | \$-369.51 | \$-16796.75 | -0.513278% | -0.087730% |
| 2025-04-03 | \$55.05 | \$15461.64 | 0.075152% | 0.084980% |
| 2025-04-04 | \$74.83 | \$22983.61 | 0.102589% | 0.119978% |
| 2025-04-05 | \$18.98 | \$9027.27 | 0.025547% | 0.047620% |
| 2025-04-06 | \$-2121.90 | \$-231785.86 | -3.061470% | -1.282913% |
| 2025-04-07 | \$143.25 | \$45364.35 | 0.210801% | 0.317386% |
| 2025-04-08 | \$-277.69 | \$11465.56 | -0.421842% | 0.073771% |
| 2025-04-09 | \$-1835.34 | \$-89212.81 | -2.678665% | -0.668295% |
| 2025-04-10 | \$-364.03 | \$-66716.74 | -0.918781% | -0.435705% |
| 2025-04-11 | \$-1.14 | \$9834.73 | -0.045780% | 0.079784% |
| 2025-04-12 | \$-6.09 | \$-18354.57 | -0.316551% | -0.152536% |
| 2025-04-13 | \$-0.18 | \$12732.97 | -0.009065% | 0.095929% |
| 2025-04-14 | \$1.01 | \$28105.77 | 0.049424% | 0.210961% |
| 2025-04-15 | \$0.05 | \$-501.74 | -0.007495% | -0.006330% |
| 2025-04-16 | \$1.79 | \$22984.44 | 0.122654% | 0.172998% |
| TOTAL | \$-4681.92 | \$-245408.13 | -7.386760% | -1.430102% |
Experiment B
| Date | Bunni Markout (\$) | Uniswap Markout (\$) | Bunni TVL-Adj (%) | Uniswap TVL-Adj (%) |
|---|---|---|---|---|
| 2025-04-02 | \$-22.58 | \$-16796.75 | -1.112368% | -0.087730% |
| 2025-04-03 | \$1.07 | \$15461.64 | 0.082528% | 0.084980% |
| 2025-04-04 | \$2.21 | \$22983.61 | 0.171258% | 0.119978% |
| 2025-04-05 | \$0.63 | \$9027.27 | 0.047151% | 0.047620% |
| 2025-04-06 | \$-52.99 | \$-231785.86 | -4.410310% | -1.282913% |
| 2025-04-07 | \$0.91 | \$45364.35 | 0.077922% | 0.317386% |
| 2025-04-08 | \$-2.15 | \$11465.56 | -0.193508% | 0.073771% |
| 2025-04-09 | \$-24.64 | \$-89212.81 | -2.000434% | -0.668295% |
| 2025-04-10 | \$-33.35 | \$-66716.74 | -2.830805% | -0.435705% |
| 2025-04-11 | \$-0.49 | \$9834.73 | -0.040960% | 0.079784% |
| 2025-04-12 | \$-2.79 | \$-18354.57 | -0.226915% | -0.152536% |
| 2025-04-13 | \$1.85 | \$12732.97 | 0.152360% | 0.095929% |
| 2025-04-14 | \$1.02 | \$28105.77 | 0.083627% | 0.210961% |
| 2025-04-15 | \$0.02 | \$-501.74 | -0.015734% | -0.006330% |
| 2025-04-16 | \$2.55 | \$22984.44 | 0.298960% | 0.172998% |
| TOTAL | \$-128.73 | \$-245408.13 | -9.917228% | -1.430102% |
Experiment C
| Date | Bunni Markout (\$) | Uniswap Markout (\$) | Bunni TVL-Adj (%) | Uniswap TVL-Adj (%) |
|---|---|---|---|---|
| 2025-04-02 | \$-12.50 | \$-16796.75 | -0.523203% | -0.087730% |
| 2025-04-03 | \$1.78 | \$15461.64 | 0.121918% | 0.084980% |
| 2025-04-04 | \$1.72 | \$22983.61 | 0.117761% | 0.119978% |
| 2025-04-05 | \$0.48 | \$9027.27 | 0.032120% | 0.047620% |
| 2025-04-06 | \$-38.67 | \$-231785.86 | -2.780250% | -1.282913% |
| 2025-04-07 | \$5.39 | \$45364.35 | 0.395140% | 0.317386% |
| 2025-04-08 | \$-4.01 | \$11465.56 | -0.302648% | 0.073771% |
| 2025-04-09 | \$-31.10 | \$-89212.81 | -2.231630% | -0.668295% |
| 2025-04-10 | \$-8.14 | \$-66716.74 | -0.601404% | -0.435705% |
| 2025-04-11 | \$-0.22 | \$9834.73 | -0.015811% | 0.079784% |
| 2025-04-12 | \$-3.89 | \$-18354.57 | -0.279299% | -0.152536% |
| 2025-04-13 | \$0.23 | \$12732.97 | 0.016821% | 0.095929% |
| 2025-04-14 | \$1.59 | \$28105.77 | 0.114142% | 0.210961% |
| 2025-04-15 | \$0.41 | \$-501.74 | 0.023292% | -0.006330% |
| 2025-04-16 | \$1.57 | \$22984.44 | 0.158981% | 0.172998% |
| TOTAL | \$-85.37 | \$-245408.13 | -5.754072% | -1.430102% |
Experiment D
| Date | Bunni Markout (\$) | Uniswap Markout (\$) | Bunni TVL-Adj (%) | Uniswap TVL-Adj (%) |
|---|---|---|---|---|
| 2025-04-10 | \$-3.91 | \$-66716.74 | -0.395828% | -0.435705% |
| 2025-04-11 | \$-0.06 | \$9834.73 | -0.006553% | 0.079784% |
| 2025-04-12 | \$-2.73 | \$-18354.57 | -0.268828% | -0.152536% |
| 2025-04-13 | \$0.13 | \$12732.97 | 0.012593% | 0.095929% |
| 2025-04-14 | \$0.98 | \$28105.77 | 0.096305% | 0.210961% |
| 2025-04-15 | \$0.22 | \$-501.74 | 0.021320% | -0.006330% |
| 2025-04-16 | \$1.65 | \$22984.44 | 0.165347% | 0.172998% |
| TOTAL | \$-3.73 | \$-11915.14 | -0.375646% | -0.034900% |
Experiment E
| Date | Bunni Markout (\$) | Uniswap Markout (\$) | Bunni TVL-Adj (%) | Uniswap TVL-Adj (%) |
|---|---|---|---|---|
| 2025-04-10 | \$-8.15 | \$-66716.74 | -0.827407% | -0.435705% |
| 2025-04-11 | \$-0.38 | \$9834.73 | -0.050365% | 0.079784% |
| 2025-04-12 | \$-5.11 | \$-18354.57 | -0.316740% | -0.152536% |
| 2025-04-13 | \$0.04 | \$12732.97 | 0.002627% | 0.095929% |
| 2025-04-14 | \$0.77 | \$28105.77 | 0.047716% | 0.210961% |
| 2025-04-15 | \$-0.01 | \$-501.74 | -0.001307% | -0.006330% |
| 2025-04-16 | \$1.78 | \$22984.44 | 0.112707% | 0.172998% |
| TOTAL | \$-11.06 | \$-11915.14 | -1.032769% | -0.034900% |
Experiment F
| Date | Bunni Markout (\$) | Uniswap Markout (\$) | Bunni TVL-Adj (%) | Uniswap TVL-Adj (%) |
|---|---|---|---|---|
| 2025-04-10 | \$-0.37 | \$-66716.74 | -0.038595% | -0.435705% |
| 2025-04-11 | \$-0.47 | \$9834.73 | -0.047383% | 0.079784% |
| 2025-04-12 | \$-2.35 | \$-18354.57 | -0.230420% | -0.152536% |
| 2025-04-13 | \$1.50 | \$12732.97 | 0.148672% | 0.095929% |
| 2025-04-14 | \$1.67 | \$28105.77 | 0.164657% | 0.210961% |
| 2025-04-15 | \$-3.06 | \$-501.74 | 0.023312% | -0.006330% |
| 2025-04-16 | \$21.84 | \$22984.44 | 0.173359% | 0.172998% |
| TOTAL | \$18.76 | \$-11915.14 | 0.193602% | -0.034900% |
Experiment F with rebalance markouts
| Date | Swaps | Δ ETH | Δ USDC | Price 0 | Price 1 | Daily Markout (\$) | Rebalance Markout (\$) | Cum Markout (\$) | TVL-Adj Markout | Cum TVL-Adj Markout |
|---|---|---|---|---|---|---|---|---|---|---|
| 2025-04-09 | 75 | -0.156110 | 243.914938 | \$1665.82 | \$1.00 | \$-16.16 | \$0.00 | \$-16.16 | -1.585219% | -1.585219% |
| 2025-04-10 | 107 | 0.168793 | -261.305511 | \$1522.53 | \$1.00 | \$-2.34 | \$-1.96 | \$-18.50 | -0.236629% | -1.821848% |
| 2025-04-11 | 161 | -0.080820 | 126.218708 | \$1567.57 | \$1.00 | \$-0.47 | \$0.00 | \$-18.97 | -0.047383% | -1.869231% |
| 2025-04-12 | 75 | -0.073571 | 118.672898 | \$1644.87 | \$1.00 | \$-2.35 | \$0.00 | \$-21.32 | -0.230420% | -2.099651% |
| 2025-04-13 | 170 | 0.251169 | -407.617046 | \$1596.11 | \$1.00 | \$-2.60 | \$-4.10 | \$-23.92 | -0.258969% | -2.358619% |
| 2025-04-14 | 168 | -0.034613 | 54.752712 | \$1622.46 | \$1.00 | \$0.13 | \$-1.54 | \$-23.79 | 0.012951% | -2.345668% |
| 2025-04-15 | 964 | 1.819352 | -2963.224295 | \$1587.78 | \$1.00 | \$-38.62 | \$-35.56 | \$-62.41 | -0.261981% | -2.607649% |
| 2025-04-16 | 647 | -0.820930 | 1302.741235 | \$1577.74 | \$1.00 | \$14.67 | \$-7.17 | \$-47.74 | 0.116434% | -2.491215% |
| 2025-04-17 | 575 | -0.079813 | 140.872912 | \$1583.20 | \$1.00 | \$14.51 | \$0.00 | \$-33.23 | 0.114779% | -2.376436% |
| Date | Bunni Markout (\$) | Uniswap Markout (\$) | Bunni TVL-Adj (%) | Uniswap TVL-Adj (%) |
|---|---|---|---|---|
| 2025-04-10 | \$-2.34 | \$-66716.74 | -0.236629% | -0.435705% |
| 2025-04-11 | \$-0.47 | \$9834.73 | -0.047383% | 0.079784% |
| 2025-04-12 | \$-2.35 | \$-18354.57 | -0.230420% | -0.152536% |
| 2025-04-13 | \$-2.60 | \$12732.97 | -0.258969% | 0.095929% |
| 2025-04-14 | \$0.13 | \$28105.77 | 0.012951% | 0.210961% |
| 2025-04-15 | \$-38.62 | \$-501.74 | -0.261981% | -0.006330% |
| 2025-04-16 | \$14.67 | \$22984.44 | 0.116434% | 0.172998% |
| 2025-04-17 | \$14.51 | \$17473.10 | 0.114779% | 0.130329% |
| TOTAL | \$-17.07 | \$5557.96 | -0.791218% | 0.095429% |
Experiment F with rebalance markouts at 0% slippage
| Date | Swaps | Δ WETH | Δ USDC | Price 0 | Price 1 | Daily Markout (\$) | Rebalance Markout (\$) | Cum Markout (\$) | TVL-Adj Markout | Cum TVL-Adj Markout |
|---|---|---|---|---|---|---|---|---|---|---|
| 2025-04-09 | 36452 | -1409.986529 | 2255738.014050 | \$1662.94 | \$1.00 | \$-89212.81 | N/A | \$-89212.81 | -0.668295% | -0.668295% |
| 2025-04-10 | 21366 | 1094.391738 | -1732800.028283 | \$1522.28 | \$1.00 | \$-66716.74 | N/A | \$-155929.55 | -0.435705% | -1.104000% |
| 2025-04-11 | 19210 | -660.539891 | 1045882.903731 | \$1568.46 | \$1.00 | \$9834.73 | N/A | \$-146094.83 | 0.079784% | -1.024216% |
| 2025-04-12 | 17094 | -927.992695 | 1509533.361047 | \$1646.40 | \$1.00 | \$-18354.57 | N/A | \$-164449.40 | -0.152536% | -1.176753% |
| 2025-04-13 | 19786 | 185.435652 | -283727.064791 | \$1598.65 | \$1.00 | \$12732.97 | N/A | \$-151716.42 | 0.095929% | -1.080824% |
| 2025-04-14 | 18984 | -793.436976 | 1314532.600075 | \$1621.27 | \$1.00 | \$28105.77 | N/A | \$-123610.65 | 0.210961% | -0.869864% |
| 2025-04-15 | 18369 | 672.226865 | -1067309.055671 | \$1586.81 | \$1.00 | \$-501.74 | N/A | \$-124112.40 | -0.006330% | -0.876193% |
| 2025-04-16 | 19805 | -111.248667 | 198560.268163 | \$1578.20 | \$1.00 | \$22984.44 | N/A | \$-101127.95 | 0.172998% | -0.703195% |
| 2025-04-17 | 16120 | -246.618871 | 407684.812959 | \$1582.16 | \$1.00 | \$17473.10 | N/A | \$-83654.85 | 0.130329% | -0.572866% |
| Date | Bunni Markout (\$) | Uniswap Markout (\$) | Bunni TVL-Adj (%) | Uniswap TVL-Adj (%) |
|---|---|---|---|---|
| 2025-04-10 | \$-1.93 | \$-66716.74 | -0.195695% | -0.435705% |
| 2025-04-11 | \$-0.47 | \$9834.73 | -0.047383% | 0.079784% |
| 2025-04-12 | \$-2.35 | \$-18354.57 | -0.230420% | -0.152536% |
| 2025-04-13 | \$-0.98 | \$12732.97 | -0.097668% | 0.095929% |
| 2025-04-14 | \$1.73 | \$28105.77 | 0.169789% | 0.210961% |
| 2025-04-15 | \$-29.75 | \$-501.74 | -0.190800% | -0.006330% |
| 2025-04-16 | \$23.57 | \$22984.44 | 0.187124% | 0.172998% |
| 2025-04-17 | \$14.51 | \$17473.10 | 0.114779% | 0.130329% |
| TOTAL | \$4.32 | \$5557.96 | -0.290274% | 0.095429% |
Volume data
Due to the large number of router addresses, only the top 10 are listed for each pool.
Experiment A
| Rank | Router Address | Label | Category | Volume (USD) | Swaps | % of Pool Volume |
|---|---|---|---|---|---|---|
| 1 | 0x0000000000001ff3684f28c67538d4d072c22734 | 0x Allowance Holder | Retail | \$904,187.4019 | 8176 | 28.92% |
| 2 | 0x0000002c67d68170c8ce06fe78d7e37895c41255 | Bunni Arb Bot | Bunni Bot | \$627,829.7428 | 2183 | 20.08% |
| 3 | 0x5093ef099346ffe58283207e221dada47bfd862a | MEV Bot (0x5093ef) | MEV Bot | \$393,876.7221 | 3482 | 12.60% |
| 4 | 0x2d5805a423d6ce771f06972ad4499f120902631a | MEV Bot (0x2d5805) | MEV Bot | \$337,890.7363 | 2483 | 10.81% |
| 5 | 0xeeeeee9ec4769a09a76a83c7bc42b185872860ee | Relay Router | Retail | \$314,248.0644 | 7182 | 10.05% |
| 6 | 0xfb33f10738d6e83a049678c1fcb9eb8b78d1417f | 0x MetaTxn Settler | Retail | \$77,477.6516 | 616 | 2.48% |
| 7 | 0x9008d19f58aabd9ed0d60971565aa8510560ab41 | CowSwap | Retail | \$64,488.1250 | 735 | 2.06% |
| 8 | 0xf1ceb16d94083606db7f4d98400554f17125483b | 1inch Filler (?) | Retail | \$45,321.3753 | 391 | 1.45% |
| 9 | 0xacff4cabde48944b89eb652a3b90e7bcef7dddac | MEV Bot (0xacff4c) | MEV Bot | \$43,031.7328 | 439 | 1.38% |
| 10 | 0x7ae782dcb73d02b0510e9bdb5d5720b5c493dcbd | UniswapX Filler (0x7ae782) | Retail | \$33,805.0906 | 252 | 1.08% |
Volume by Category:
| Category | Volume (USD) | Percentage |
|---|---|---|
| Retail | \$1,635,511.71 | 52.31% |
| Bunni Bot | \$627,829.74 | 20.08% |
| MEV Bot | \$782,673.49 | 25.03% |
| Unknown | \$80,715.16 | 2.58% |
Experiment B
| Rank | Router Address | Label | Category | Volume (USD) | Swaps | % of Pool Volume |
|---|---|---|---|---|---|---|
| 1 | 0x0000000000001ff3684f28c67538d4d072c22734 | 0x Allowance Holder | Retail | \$13,358.4205 | 1315 | 32.29% |
| 2 | 0xeeeeee9ec4769a09a76a83c7bc42b185872860ee | Relay Router | Retail | \$11,700.6714 | 3291 | 28.28% |
| 3 | 0x5093ef099346ffe58283207e221dada47bfd862a | MEV Bot (0x5093ef) | MEV Bot | \$3,214.9879 | 361 | 7.77% |
| 4 | 0x9008d19f58aabd9ed0d60971565aa8510560ab41 | CowSwap | Retail | \$3,043.4063 | 315 | 7.36% |
| 5 | 0x2d5805a423d6ce771f06972ad4499f120902631a | MEV Bot (0x2d5805) | MEV Bot | \$1,407.3451 | 156 | 3.40% |
| 6 | 0xf1ceb16d94083606db7f4d98400554f17125483b | 1inch Filler (?) | Retail | \$1,215.4335 | 102 | 2.94% |
| 7 | 0xaaaaaaae92cc1ceef79a038017889fdd26d23d4d | Relay Approval Proxy | Retail | \$1,128.8171 | 194 | 2.73% |
| 8 | 0xfb33f10738d6e83a049678c1fcb9eb8b78d1417f | 0x MetaTxn Settler | Retail | \$764.4168 | 57 | 1.85% |
| 9 | 0x5c9bdc801a600c006c388fc032dcb27355154cc9 | 0x Settler | Retail | \$671.7069 | 163 | 1.62% |
| 10 | 0x7ae782dcb73d02b0510e9bdb5d5720b5c493dcbd | UniswapX Filler (0x7ae782) | Retail | \$543.3051 | 34 | 1.31% |
Volume by Category:
| Category | Volume (USD) | Percentage |
|---|---|---|
| Retail | \$35,687.20 | 86.25% |
| MEV Bot | \$5,056.04 | 12.22% |
| Unknown | \$631.71 | 1.53% |
Experiment C
| Rank | Router Address | Label | Category | Volume (USD) | Swaps | % of Pool Volume |
|---|---|---|---|---|---|---|
| 1 | 0x0000000000001ff3684f28c67538d4d072c22734 | 0x Allowance Holder | Retail | \$9,092.3906 | 954 | 33.52% |
| 2 | 0xeeeeee9ec4769a09a76a83c7bc42b185872860ee | Relay Router | Retail | \$7,140.1790 | 2629 | 26.32% |
| 3 | 0x5093ef099346ffe58283207e221dada47bfd862a | MEV Bot (0x5093ef) | MEV Bot | \$2,319.3960 | 282 | 8.55% |
| 4 | 0x9008d19f58aabd9ed0d60971565aa8510560ab41 | CowSwap | Retail | \$1,777.1019 | 198 | 6.55% |
| 5 | 0x2d5805a423d6ce771f06972ad4499f120902631a | MEV Bot (0x2d5805) | MEV Bot | \$1,469.6035 | 138 | 5.42% |
| 6 | 0xf1ceb16d94083606db7f4d98400554f17125483b | 1inch Filler (?) | Retail | \$857.4272 | 87 | 3.16% |
| 7 | 0xaaaaaaae92cc1ceef79a038017889fdd26d23d4d | Relay Approval Proxy | Retail | \$543.5118 | 113 | 2.00% |
| 8 | 0xfb33f10738d6e83a049678c1fcb9eb8b78d1417f | 0x MetaTxn Settler | Retail | \$494.5793 | 46 | 1.82% |
| 9 | 0xacff4cabde48944b89eb652a3b90e7bcef7dddac | MEV Bot (0xacff4c) | MEV Bot | \$437.4292 | 59 | 1.61% |
| 10 | 0x5c9bdc801a600c006c388fc032dcb27355154cc9 | 0x Settler | Retail | \$413.9482 | 107 | 1.53% |
Volume by Category:
| Category | Volume (USD) | Percentage |
|---|---|---|
| Retail | \$22,351.53 | 82.40% |
| MEV Bot | \$4,226.43 | 15.58% |
| Unknown | \$546.35 | 2.01% |